We’re proud to announce the general availability of the cost management widget for the Oracle Cloud Dashboard. Dashboards are a critical component to running applications and workloads at scale in the cloud. Using Oracle Cloud Infrastructure (OCI) dashboards, you can derive insights, observe trends, and diagnose issues, all from a single location in the Oracle Cloud Console! The cost management widget is intended to aid FinOps practitioners on OCI and aligns with the inform phase of the FinOps framework. You can create dashboards that provide you with a quick, comprehensive insight into the state of your cloud financial management, while reaping the benefits of collaboration and access control that OCI dashboards offer.
Creating a cost management dashboard
Creating a cost management dashboard is easy. On the home page, click Dashboard, which loads the dashboard that you were last working with. If it’s your first time, you see a default dashboard. To create a dashboard, click the New Dashboard button. After entering a few details, the new dashboard is deployed, and you can see a canvas ready to work on.
To create a cost management widget, click the +Add widget button. Select the cost management widget from the list of widgets.
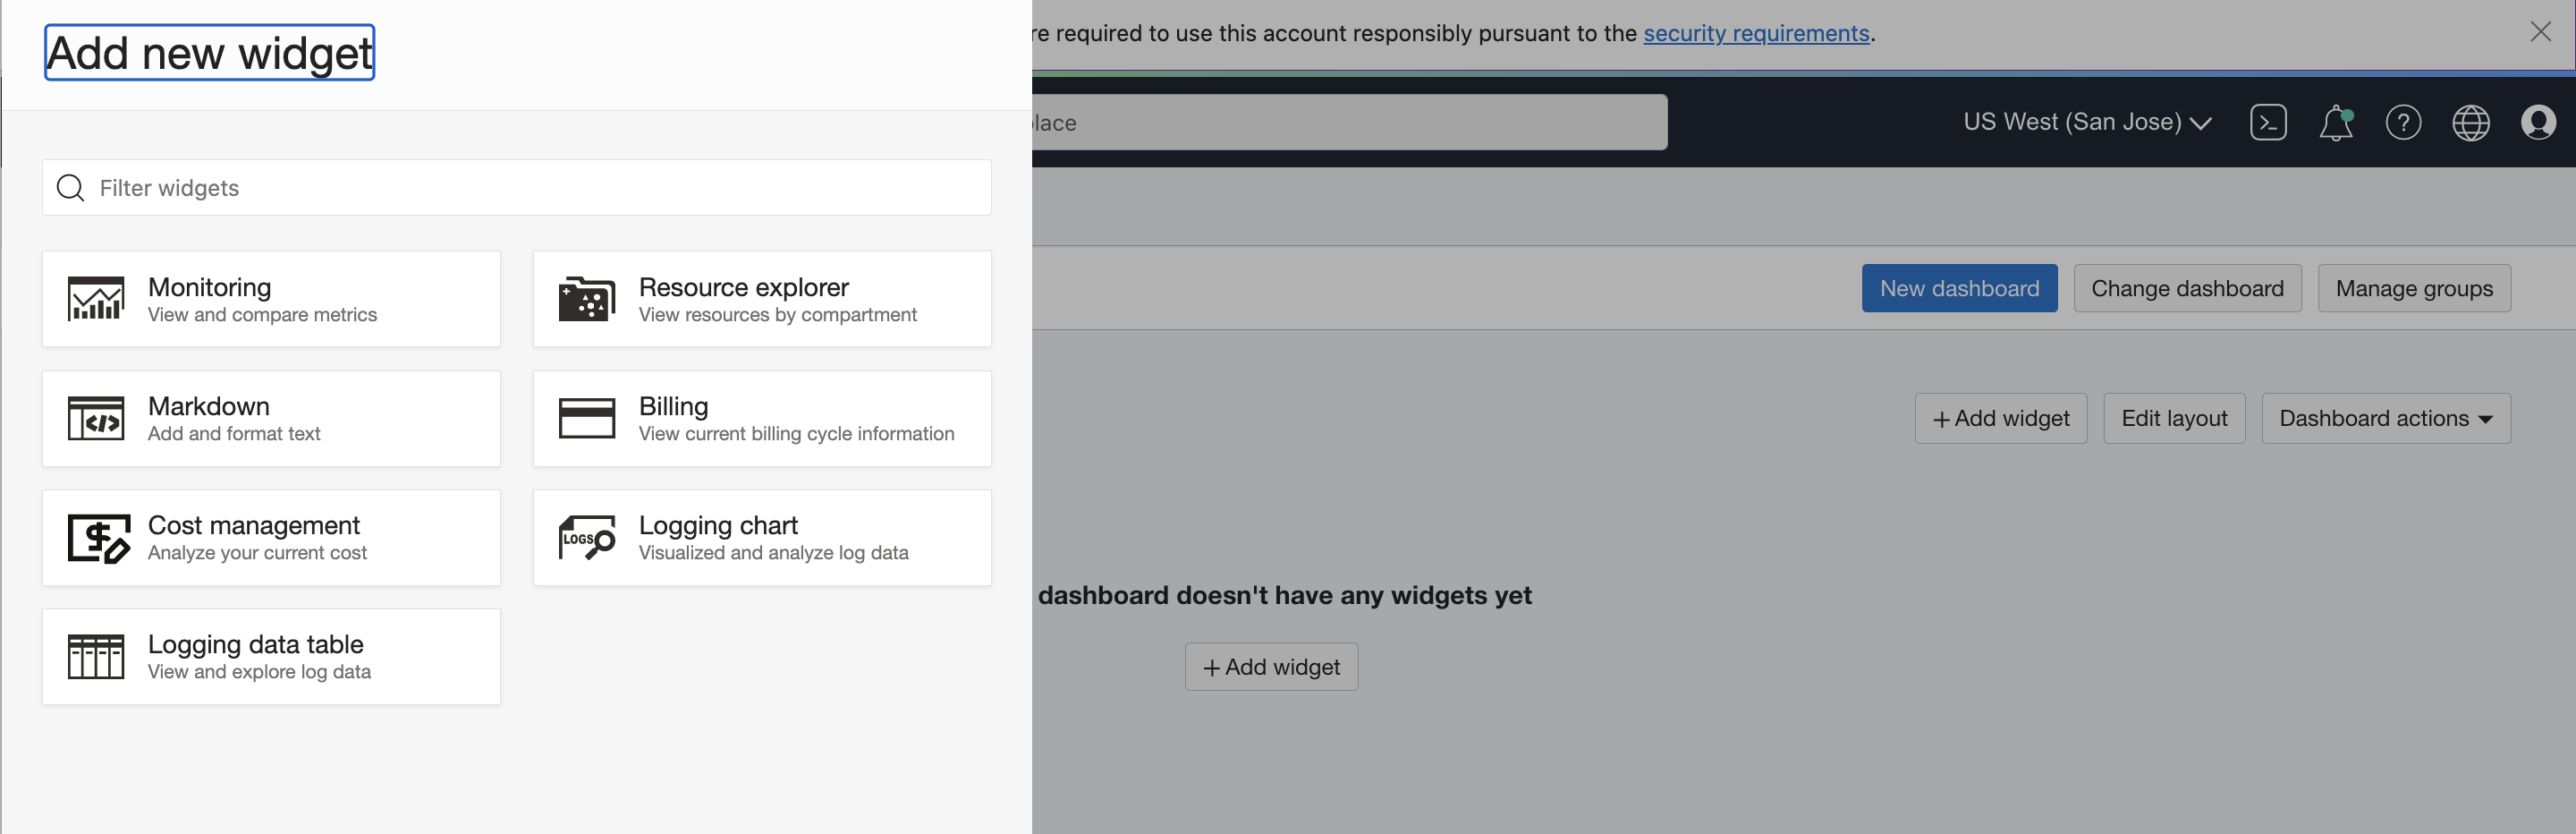
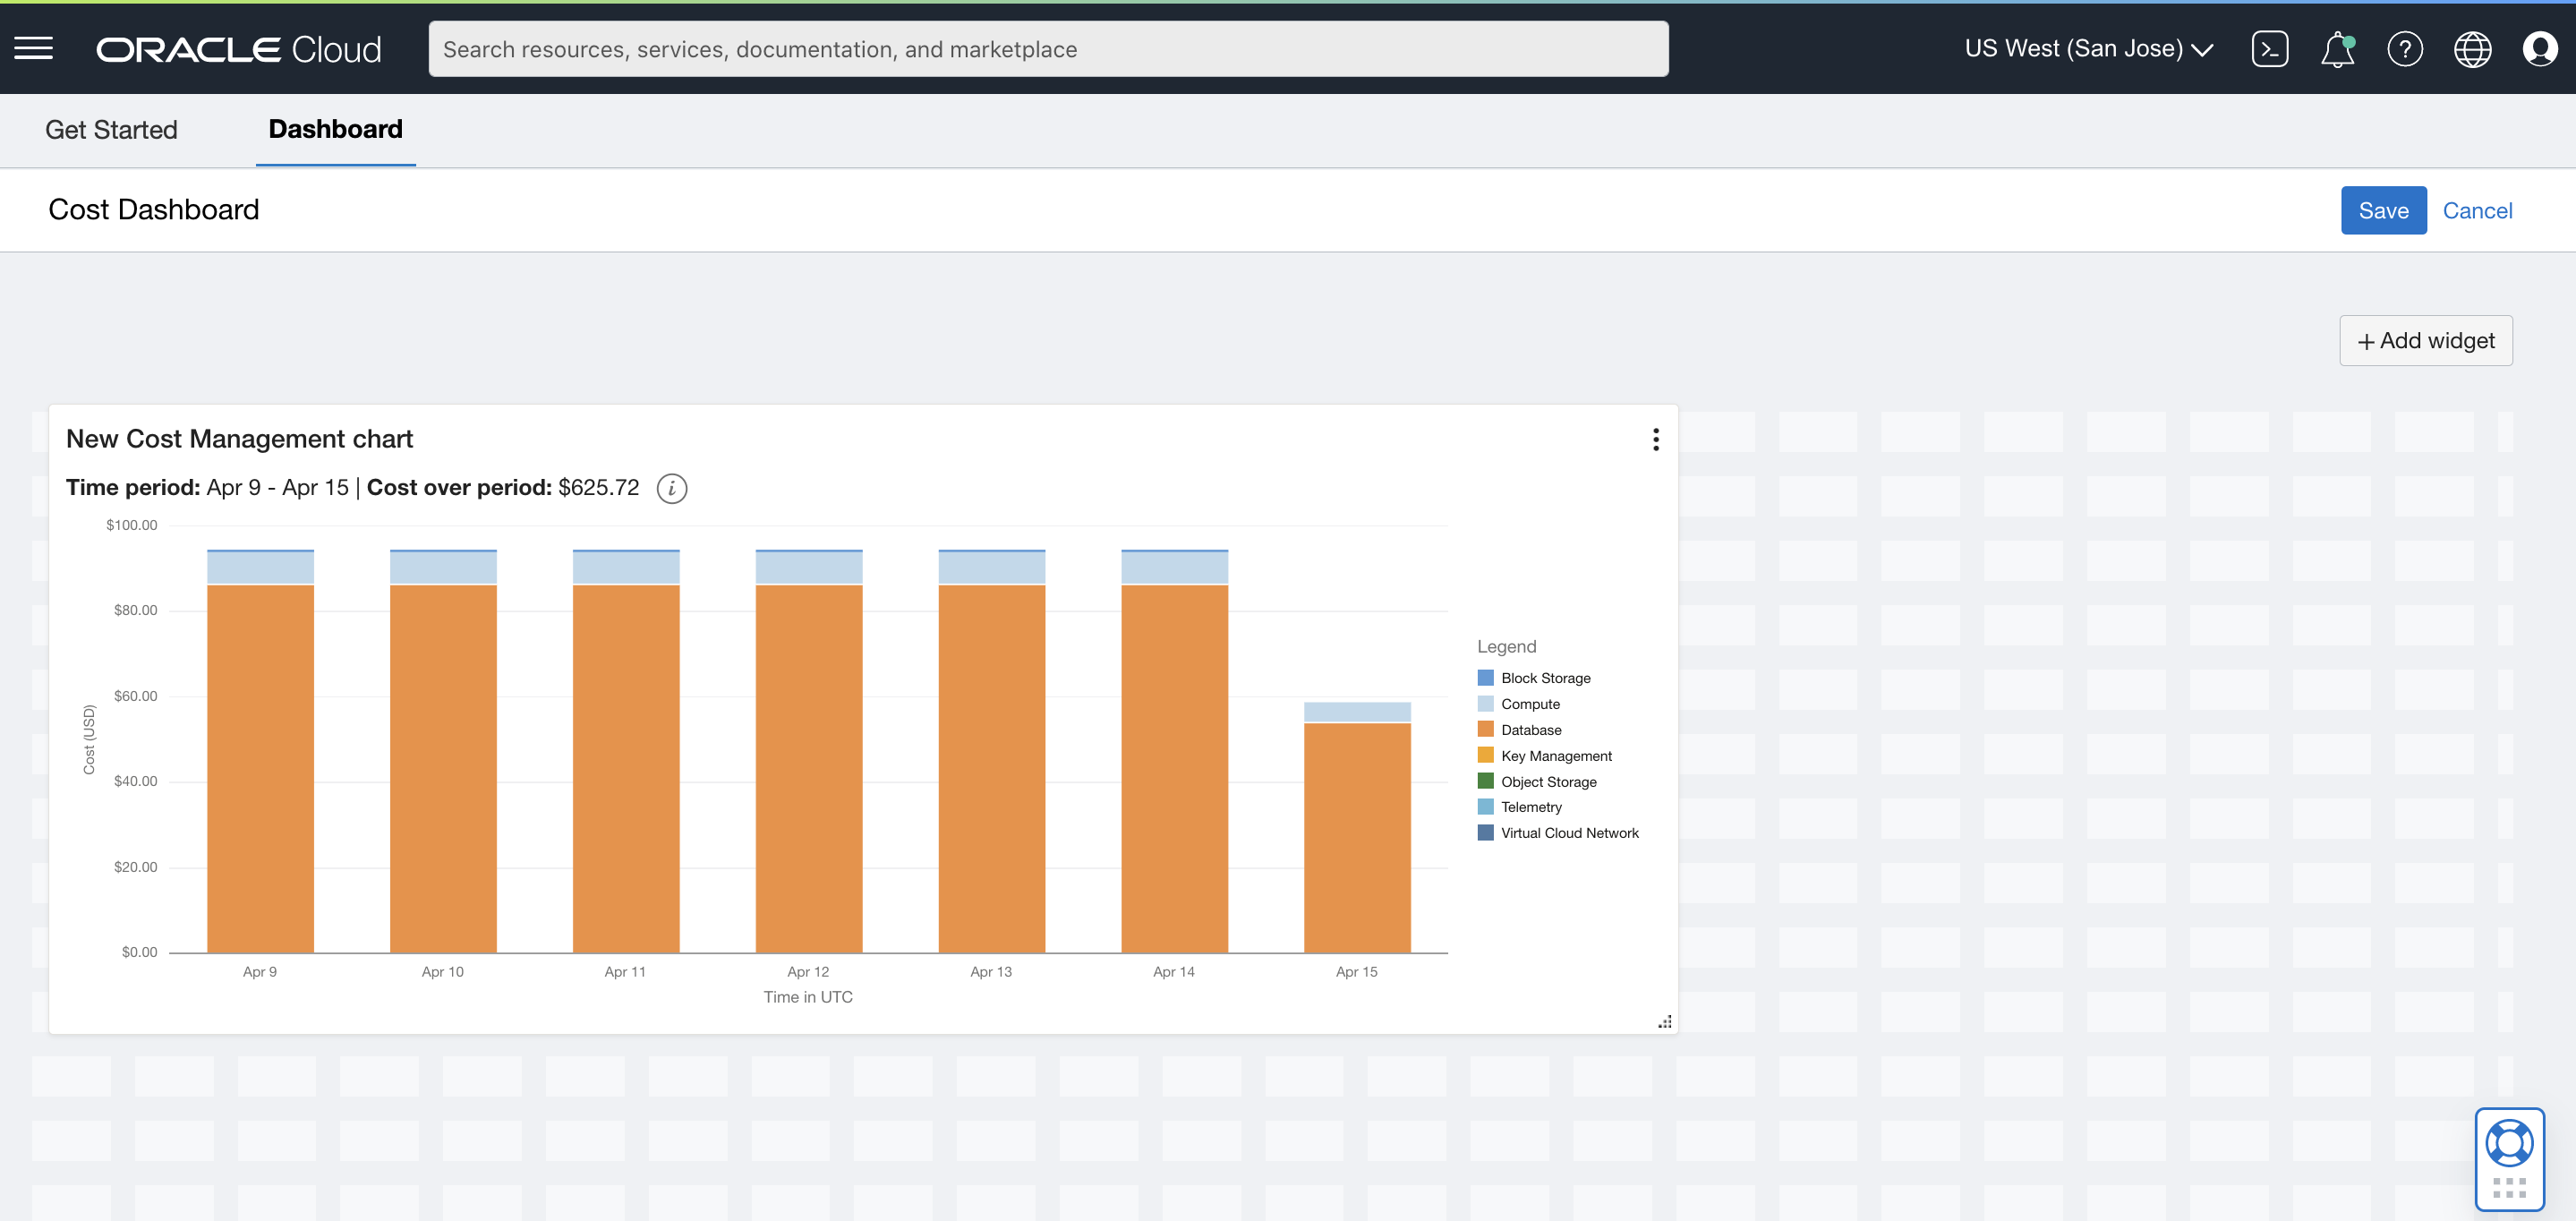
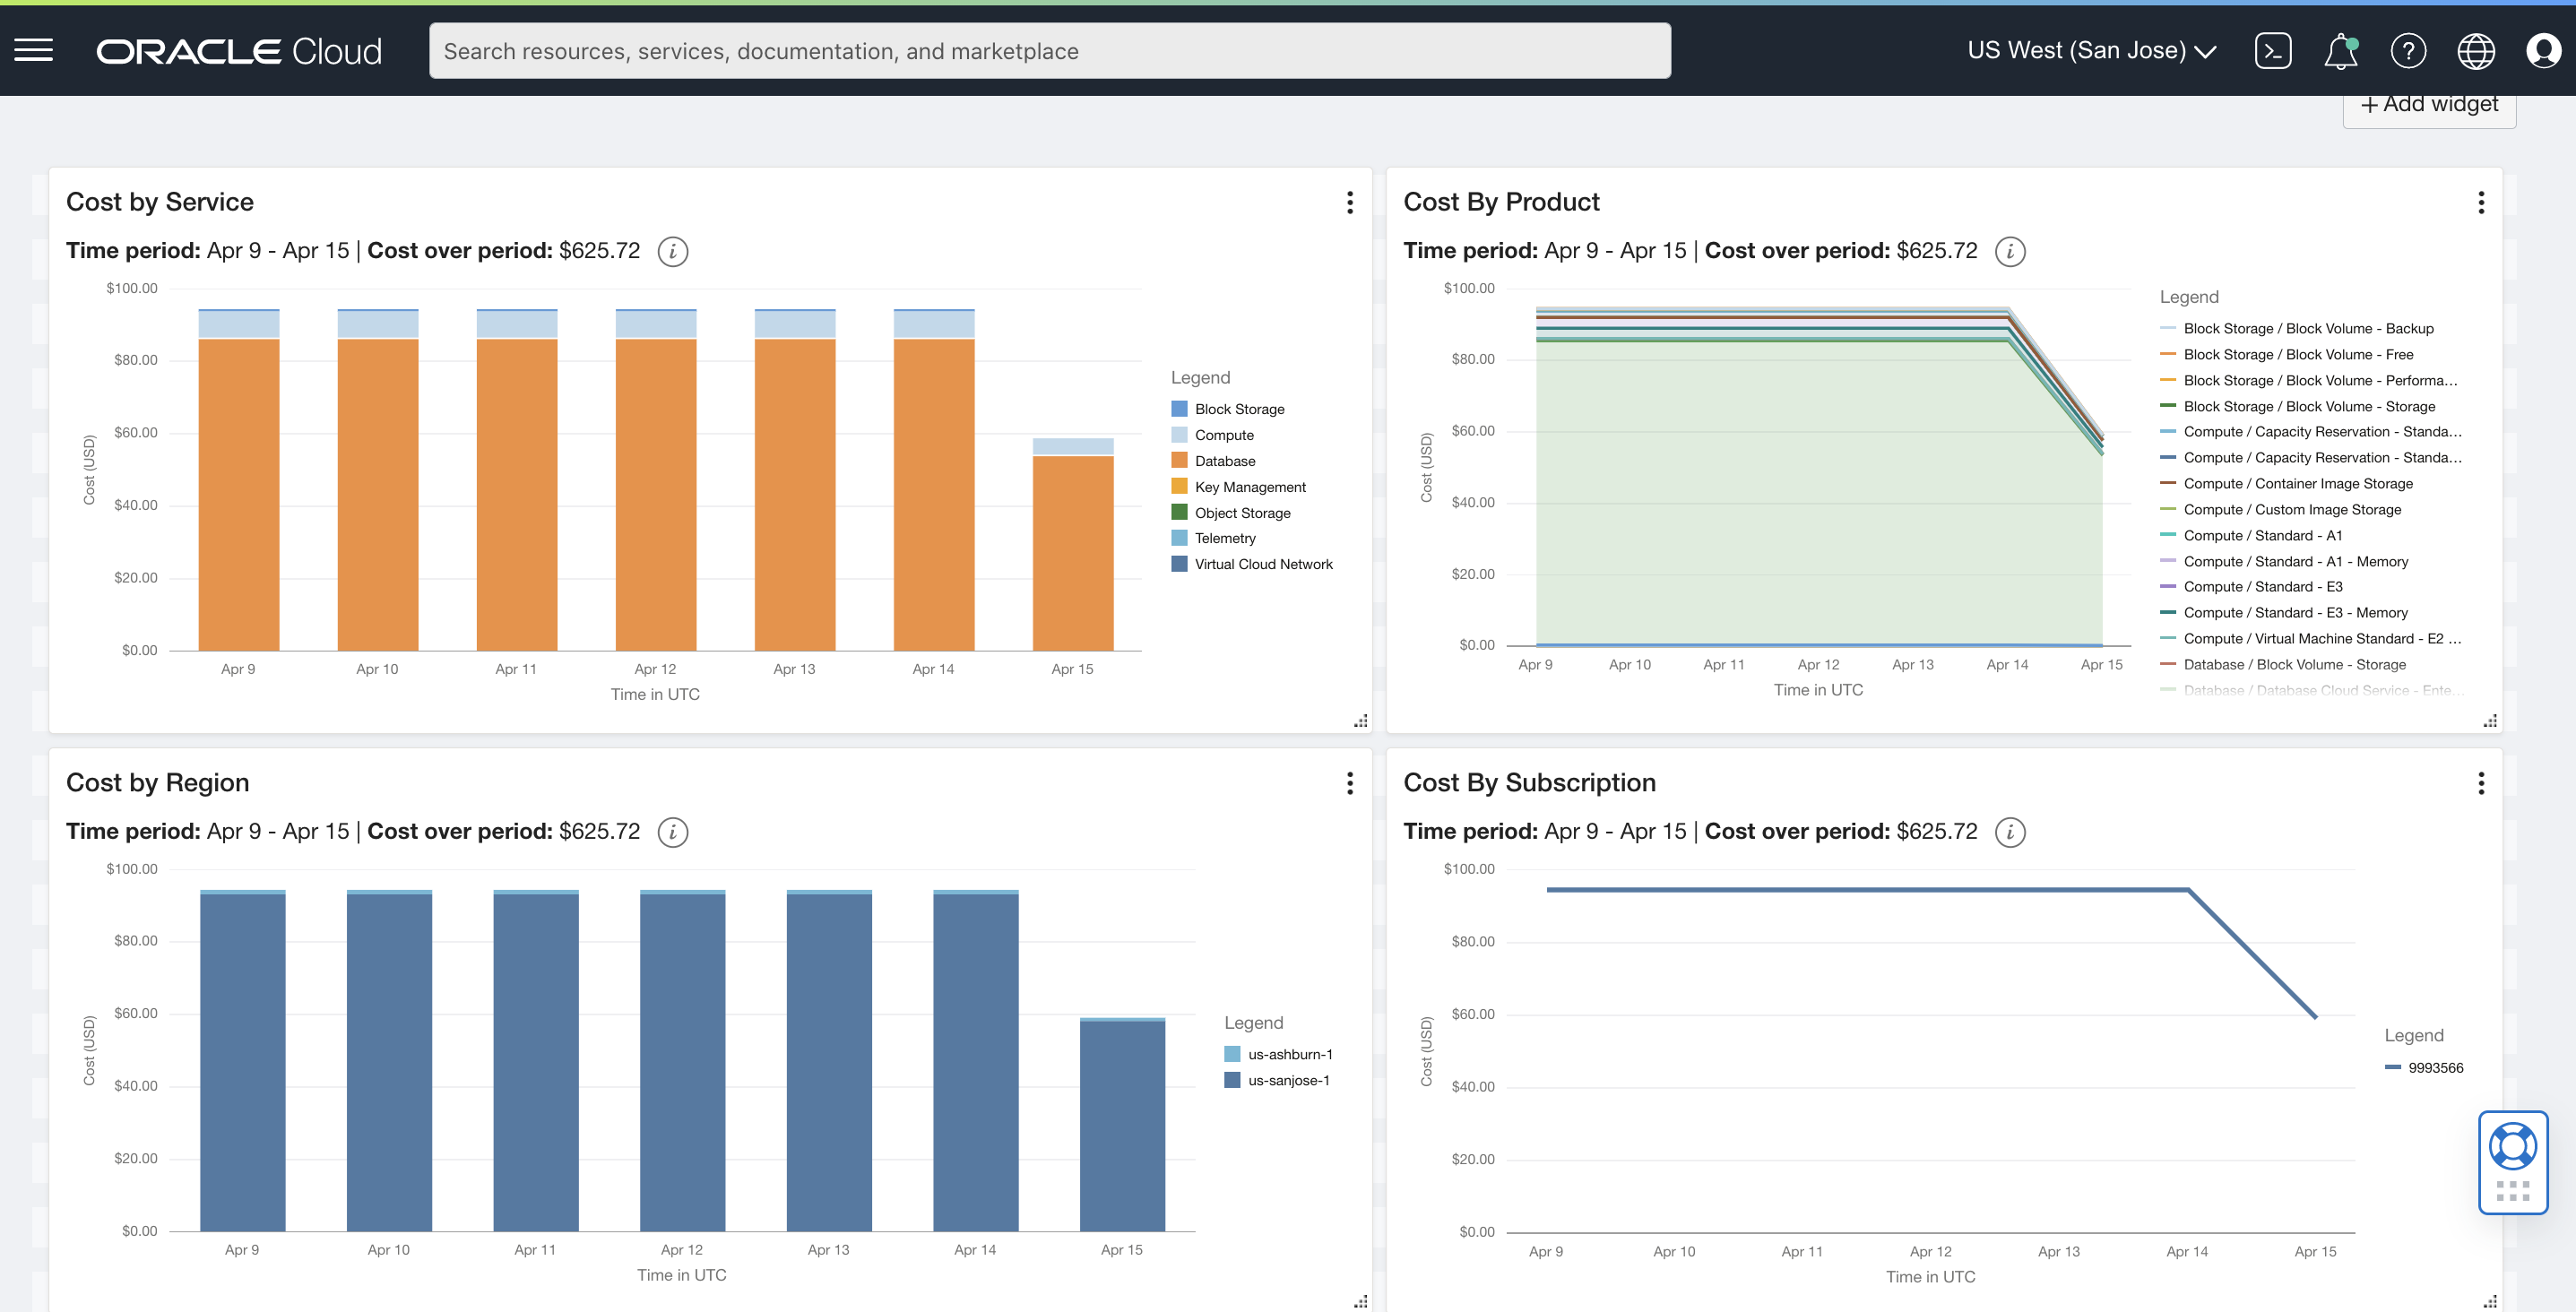
A tile is created on your dashboard showing the cost by service over the past seven days.
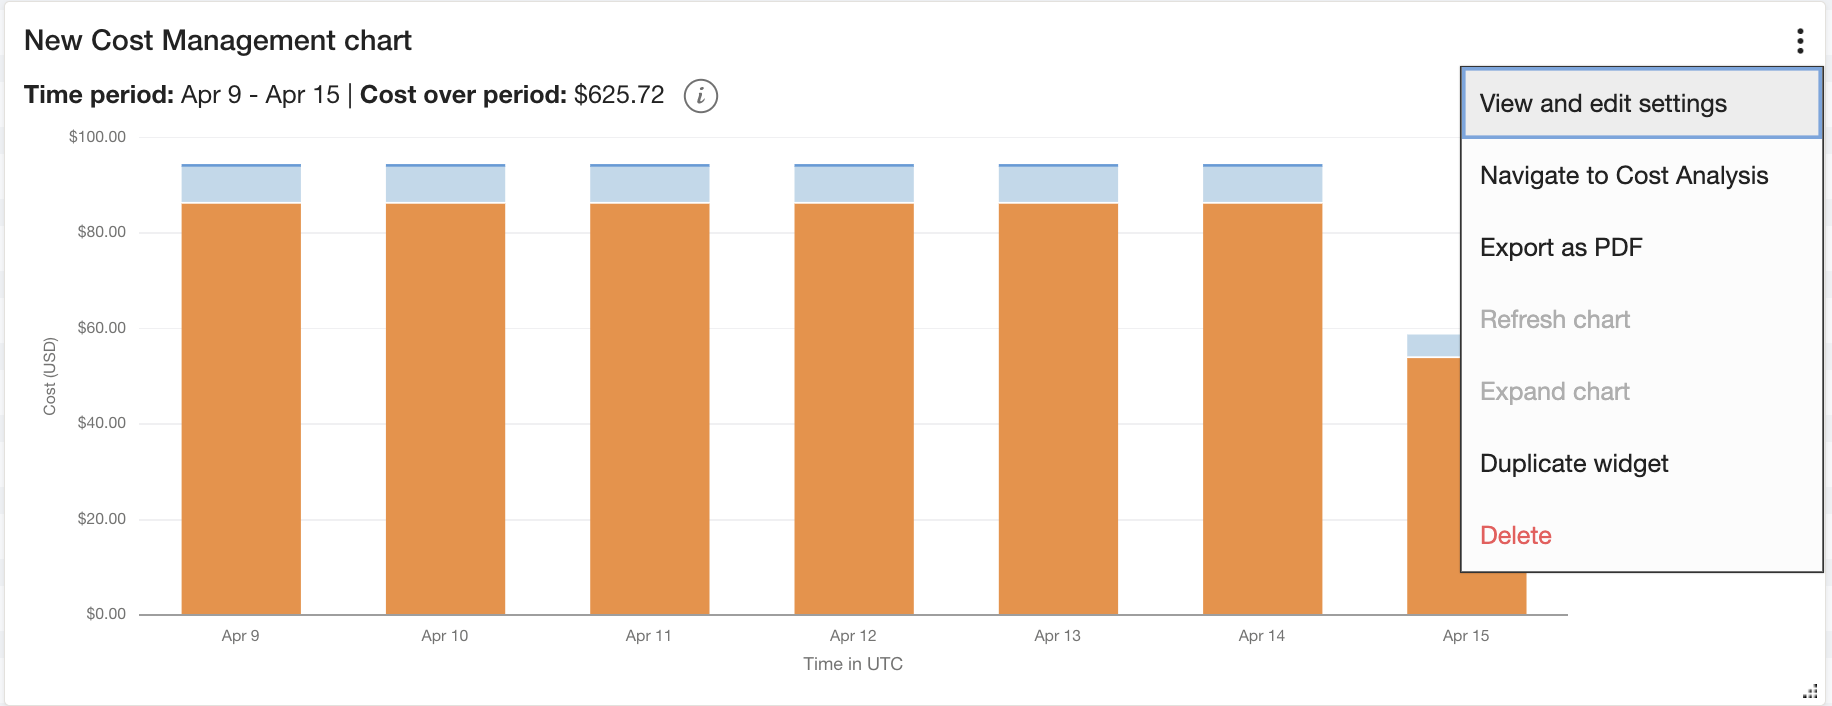
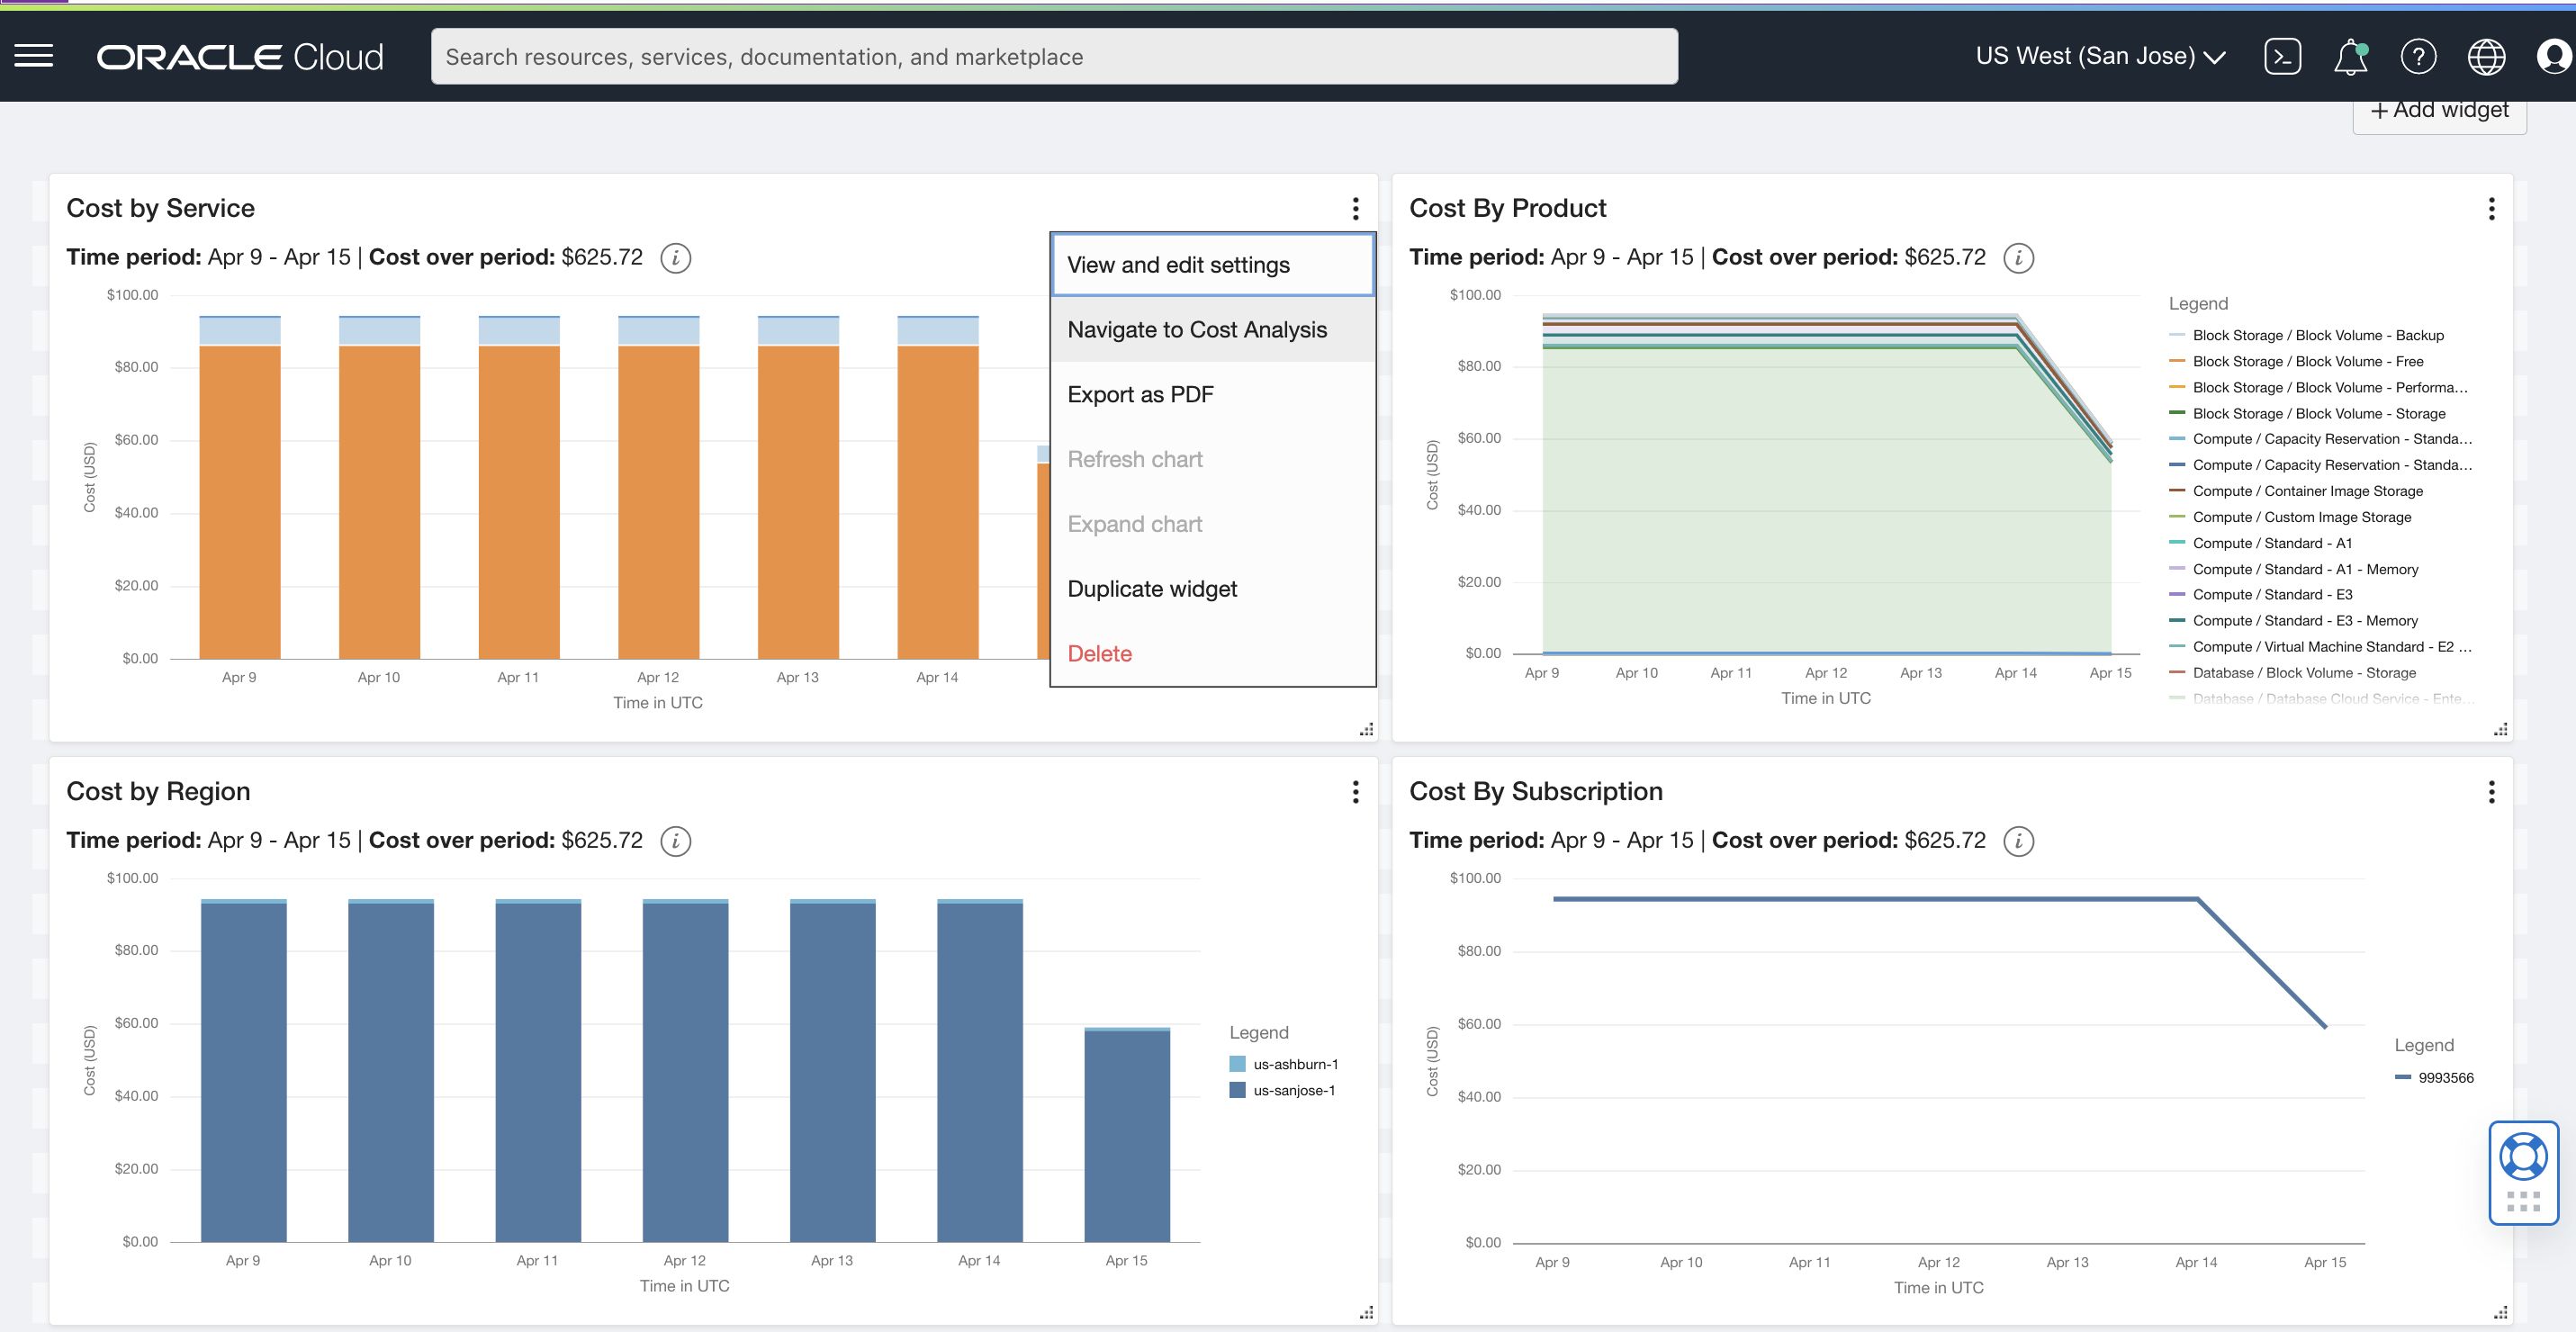
You can customize your widget by clicking the three-dot menu in the widget and select View and edit settings.
You can customize the following options:
-
Title of the widget
-
The dynamic time range for which the query runs
-
Switch between daily and monthly granularities
-
Switch between bars, lines, and stacked lines visualization options
-
Apply the same set of grouping dimensions and filters that are available in Cost Analysis
You can preview your changes by selecting the Preview changes button.
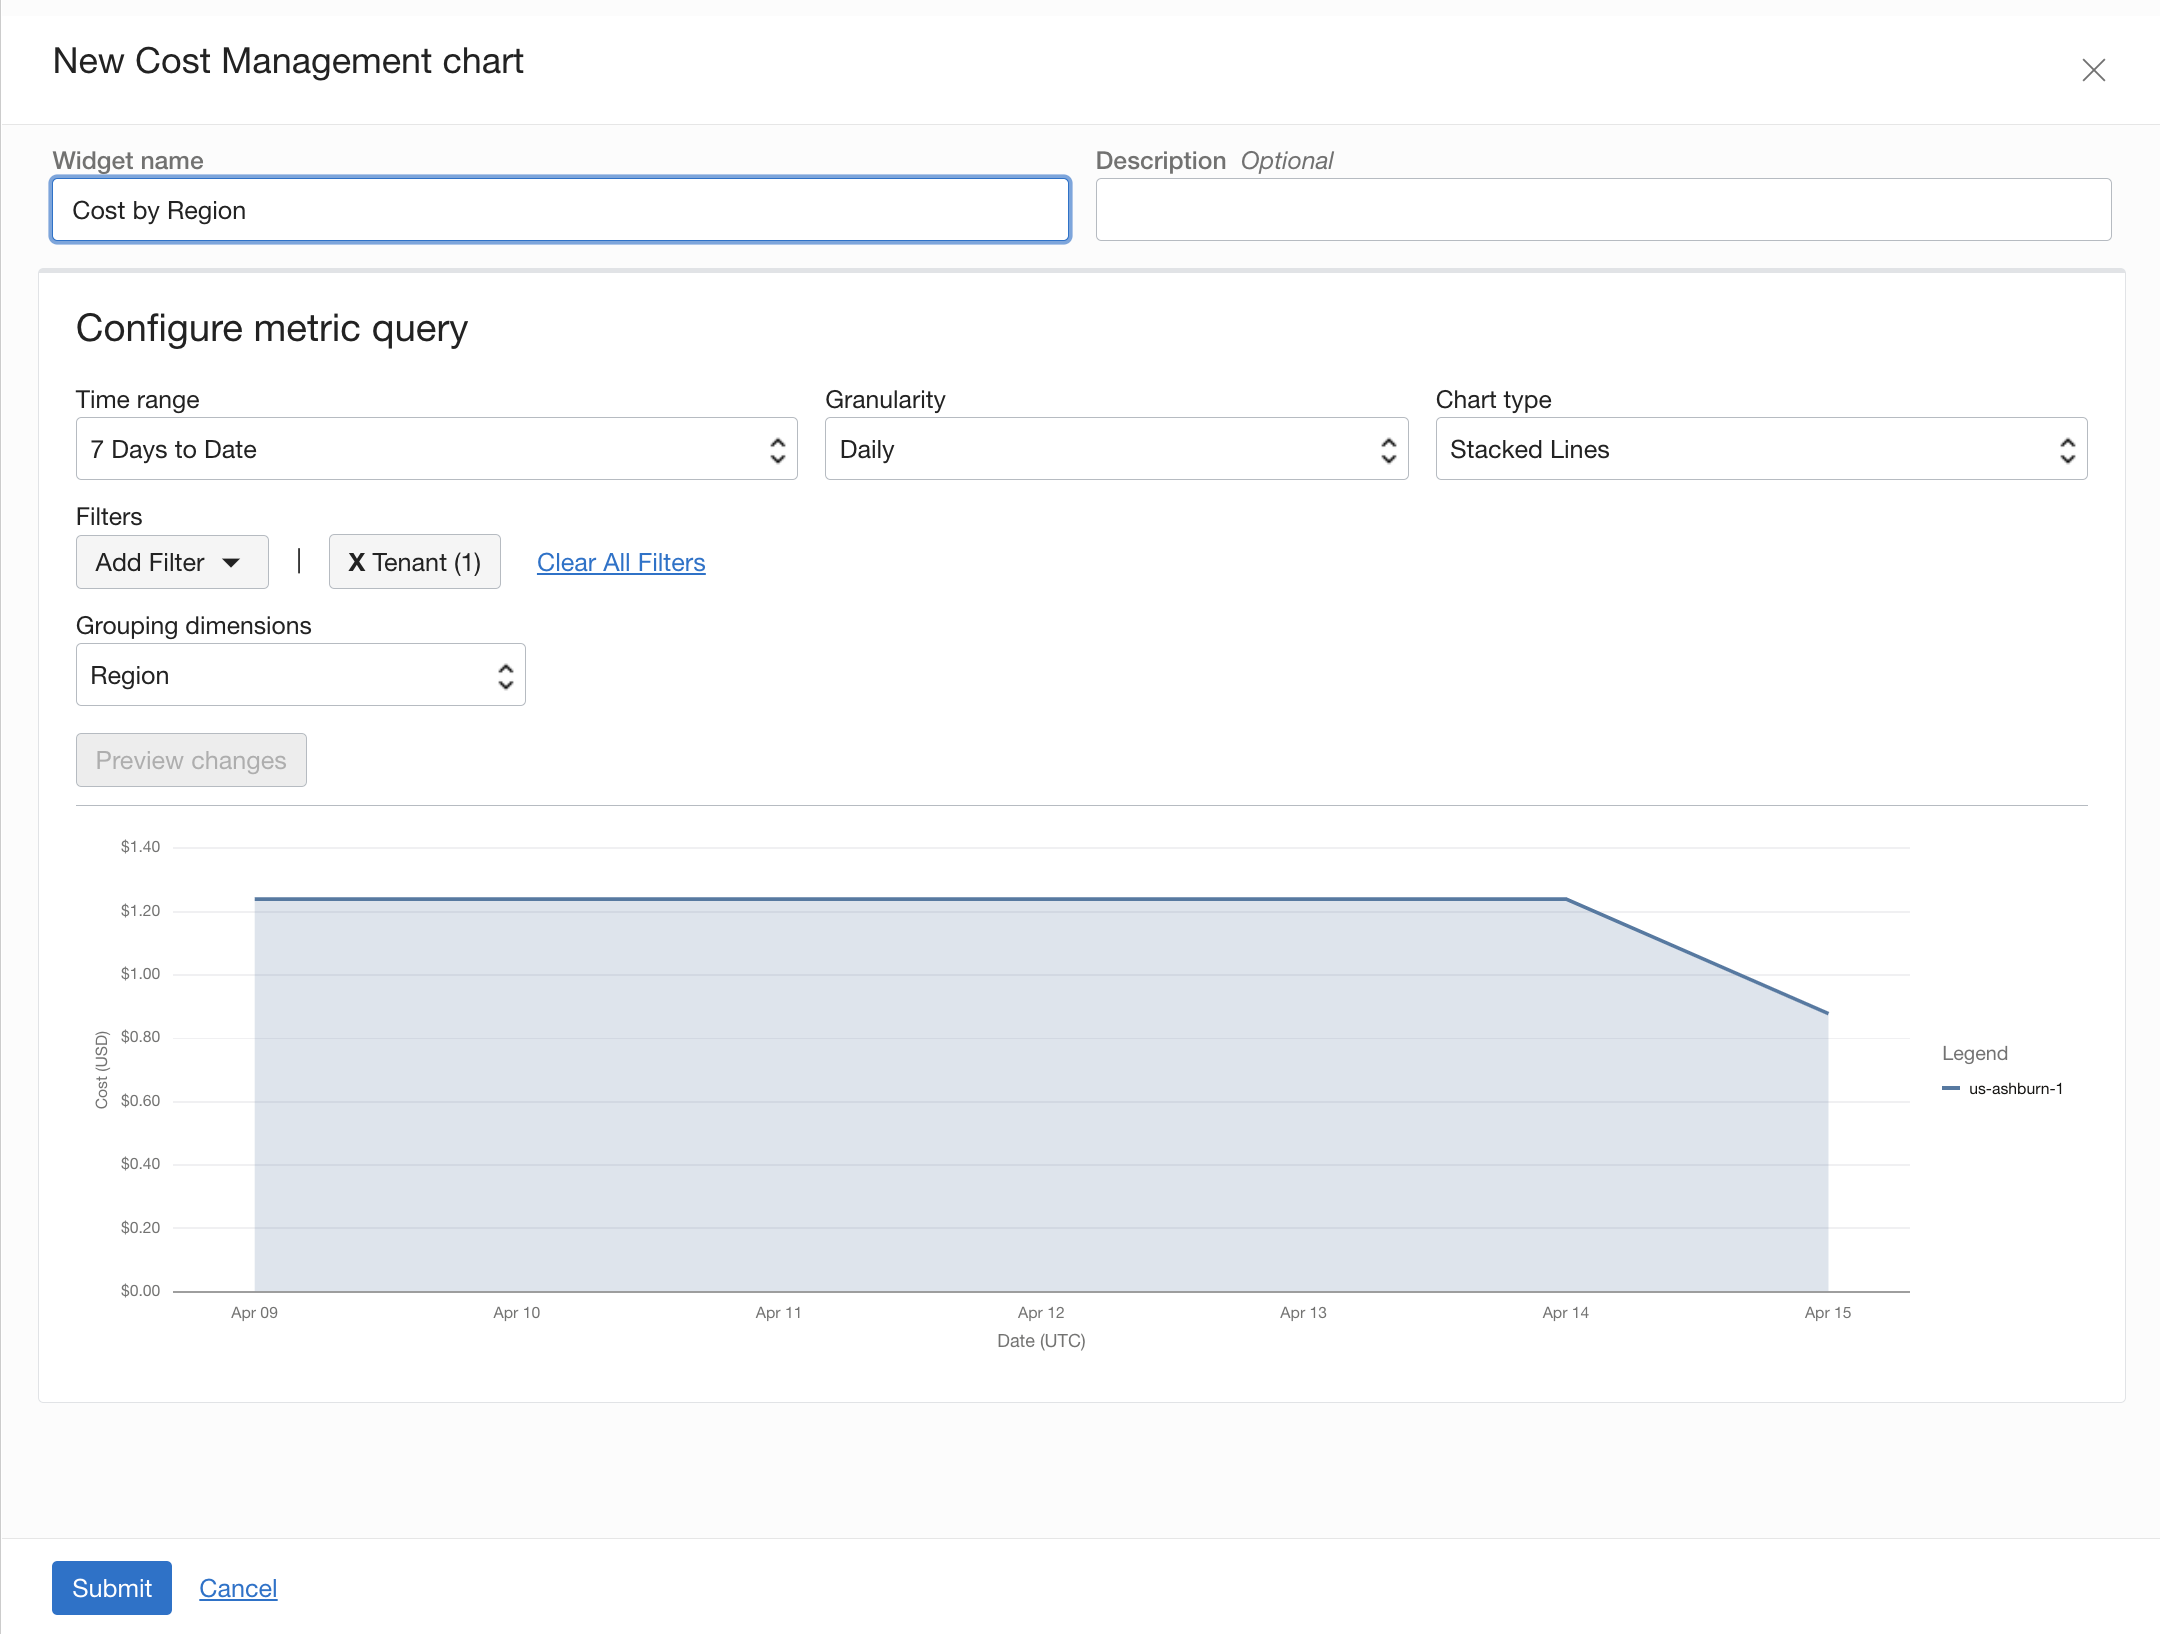
When you’re satisfied, click Submit to add the tile to your dashboard. You can create more widgets by selecting +Add widget again or selecting the duplicate widget option under the contextual menu (three dots) and then editing settings. Within minutes, you can create a comprehensive dashboard that communicates your cloud financial management picture.
Other Features
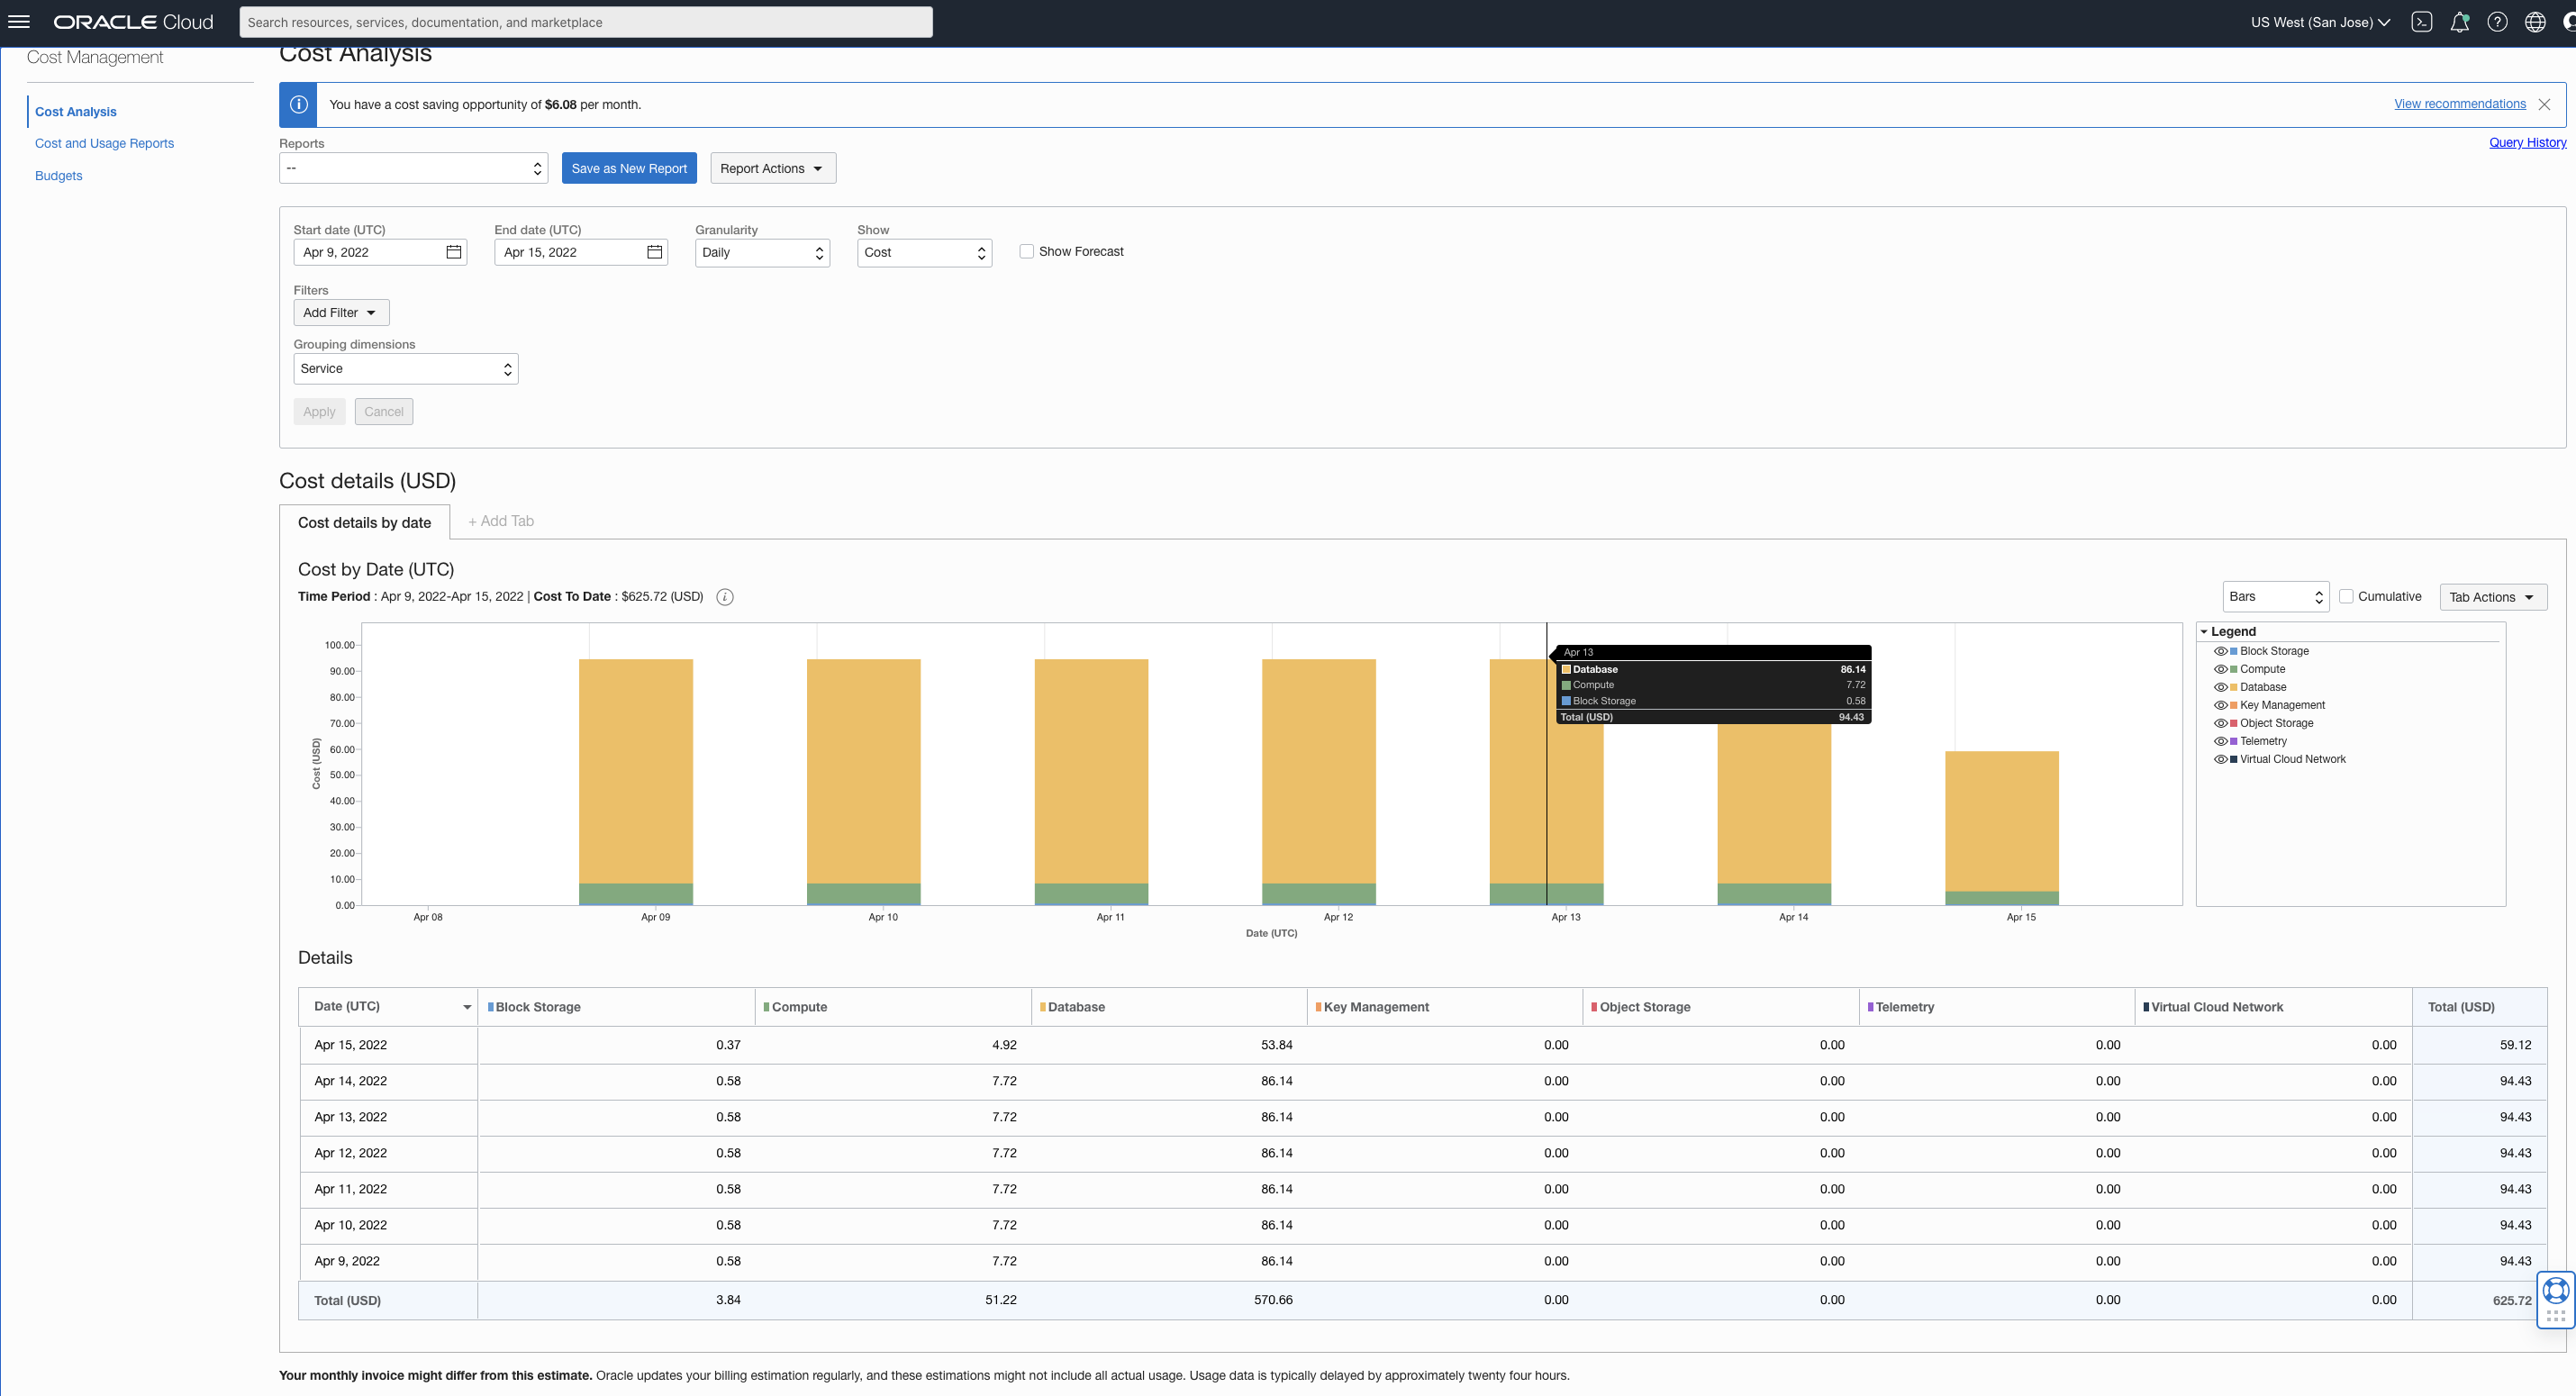
You can look at the query powering your widget in Cost Analysis and take advantage of other capabilities, such as forecasting and custom tabs by selecting Navigate to Cost Analysis from the contextual menu from any widget. The same graph and supporting query is displayed in Cost Analysis.
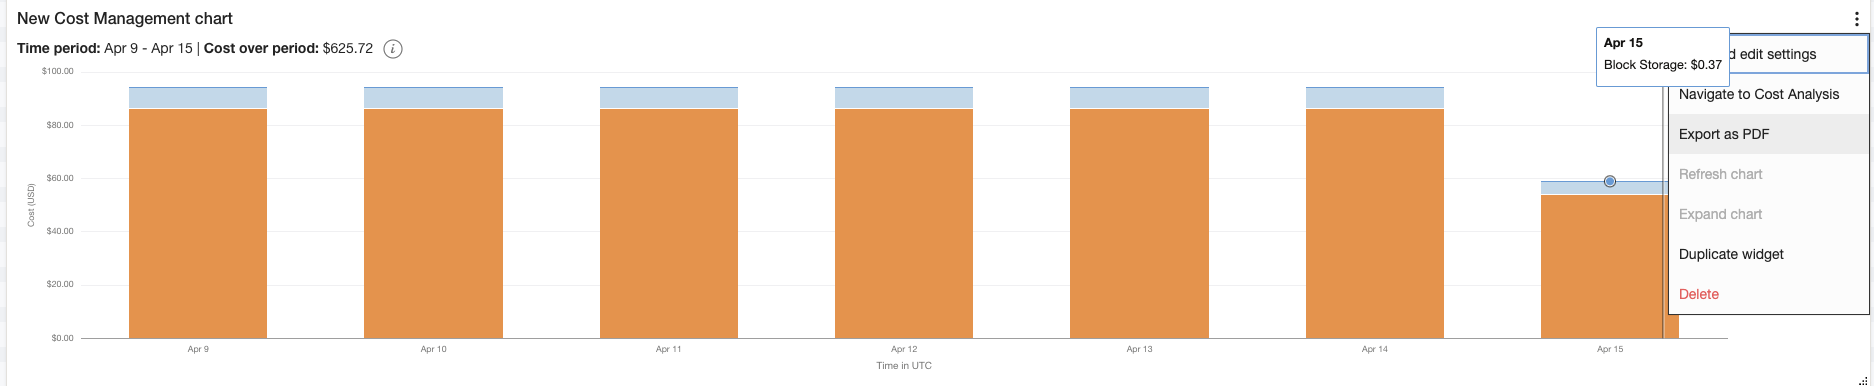
You can export both the graph shown in the widget and the data behind the graph (in a table) in PDF format by selecting Export as PDF from the contextual menu of the widget.
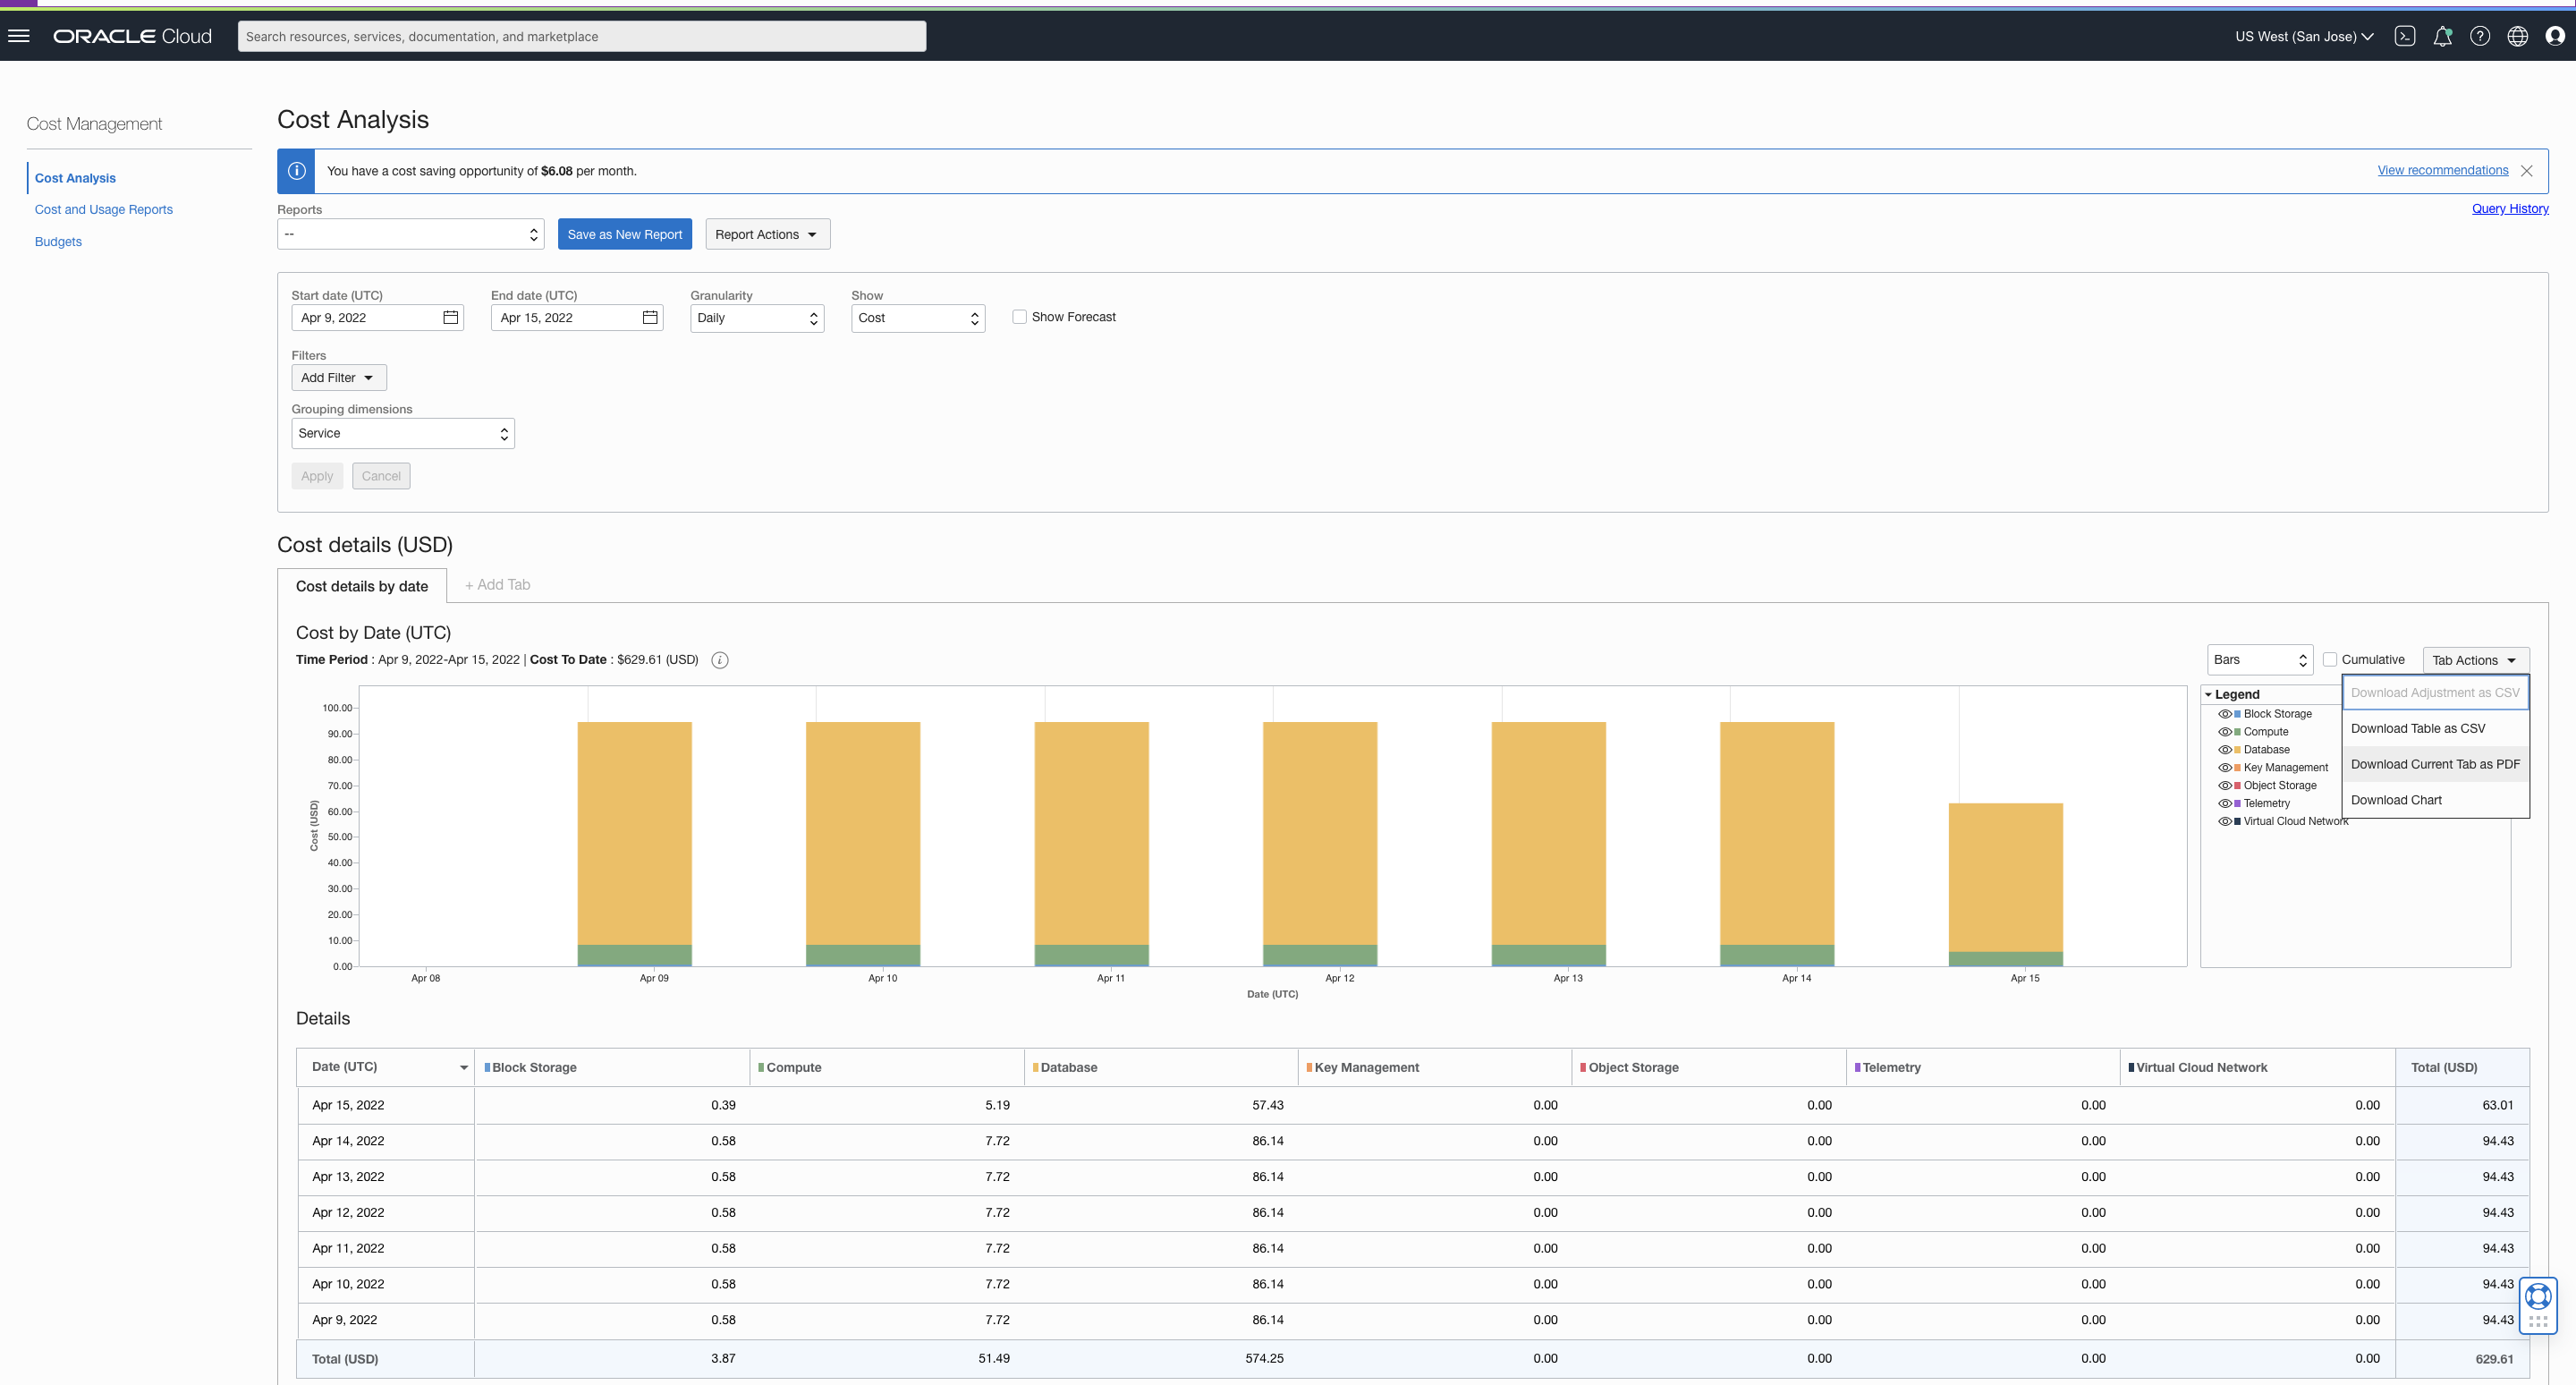
You can perform a similar action from Cost Analysis by selecting Download Current Tab as PDF from tab actions.
Conclusion
We continue to strive to make it easier for you to access your financial operations data, share, and derive insights from them. OCI Dashboards is now available in all OCI commercial regions. OCI Dashboards is accessible through the Oracle Cloud Console, CLI, and REST API. We encourage you to create your dashboards and share feedback with us, so that we can help make your cloud journey through Oracle Cloud Infrastructure better.