A typical enterprise has workloads spread across multiple facilities, cloud providers, and geographies. But as complex as these systems are, your users expect frictionless access to your applications, no matter where they are. You need highly flexible, performant, secure, and easy-to-manage networks to meet their needs. If you’re using Oracle Cloud Infrastructure (OCI), we have you covered. OCI offers best-in-class cloud networking capabilities with integrated monitoring and observability.
The OCI network monitoring toolkit enables you to easily see, measure, and diagnose your virtual network, to help manage your connectivity requirements on a day-to-day basis. This blog post teaches you how.
See your virtual network
First, you must be able to see and visualize your network. Maybe you wrote down the network design a long time ago, but have you kept it up to date? Probably not.
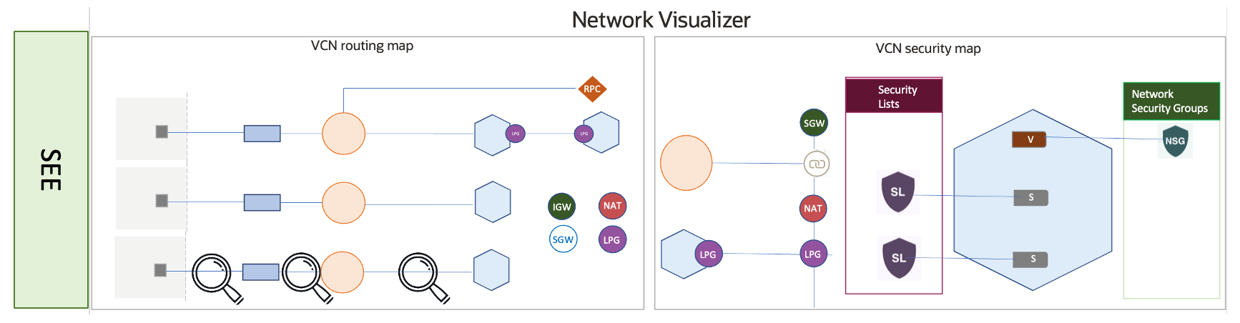
Network Visualizer enables you to visualize your entire network topology at any time. You can see the network resources and the links connecting them, starting from your on-premises all the way to the OCI virtual cloud network (VCN). You can select any resource on the topology and check the details of routing, security, and status.
Measure health and performance
Next, you need to measure your network health and performance to ensure that you’re meeting your connectivity expectations and take care of any issues.
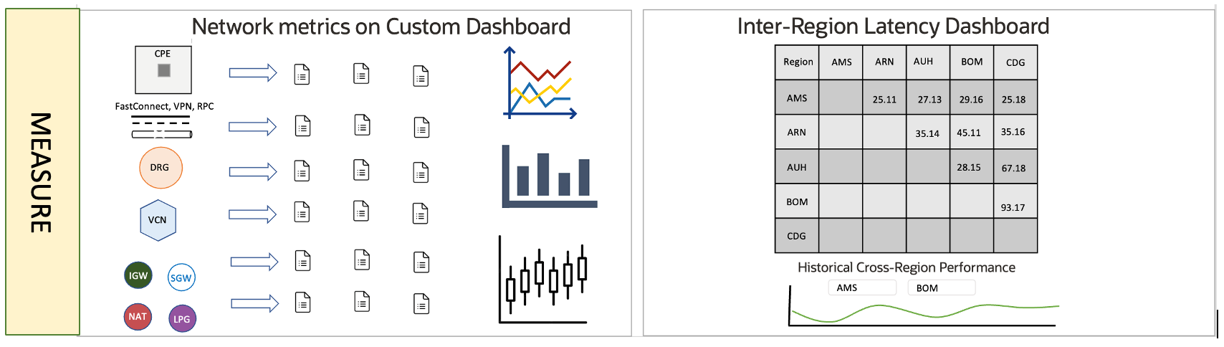
To measure the health and performance of network resources, you can use OCI network metrics. OCI supports metrics for a vast range of network resources, which include dynamic routing gateways (DRGs), FastConnect, internet gateways, network address translation (NAT) gateways, service gateways, site-to-site VPNs, and virtual network interface cards (VNICs).
To review the network performance over a period of time, you can use Metrics Explorer in the Oracle Cloud Console, which provides visibility into historical metric trends.
Diagnose your issues
Finally, you need the ability to diagnose an issue. When you’ve identified something wrong, you need to find the root cause. Maybe it’s something as simple as a down link, misconfigured security rule, or flood of unexpected traffic. Occasionally, you need to look at the traffic packets—the network equivalent of a wiretap.
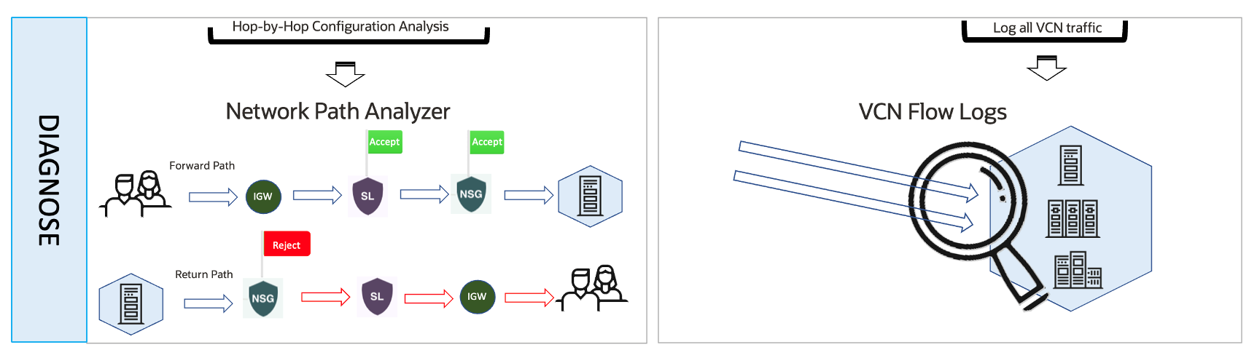
To facilitate your diagnosis, OCI offers the following features:
-
Network Path Analyzer enables you to perform a hop-by-hop analysis of routing and security policies from a specific source to a destination.
-
VCN flow logs enable you to diagnose network performance for reporting and troubleshooting purposes. You can log all the traffic entering and exiting an OCI VCN with ability to log traffic to or from specific resources.
-
For advanced troubleshooting, you can access a virtual test access point (VTAP), which allows you to mirror traffic from a designated source to a specific target.
That’s a lot of useful, OCI-native network monitoring capabilities we’re talking about! Let’s give an example to explain them all.
Monitoring in action case study
Let’s put ourselves in the shoes of the network administrator at Innovative Stuff and Things (IST), Inc, which has offices on six continents. You recently migrated some applications to OCI, but you still have your data centers (for now). It’s a complex environment. You walk into the office, and your phone is already signaling a network issue: No one can reach the ordering application. Some more issues are up, but this one is an immediate priority.
The development team has been busy. Any diagram that they sent out is likely out-of-date. So, you pull up the Network Visualizer from the Oracle Cloud Console to see the layout of the network. With Network Visualizer, you can view any resource in your topology, check routing setup, and look at security configuration details.
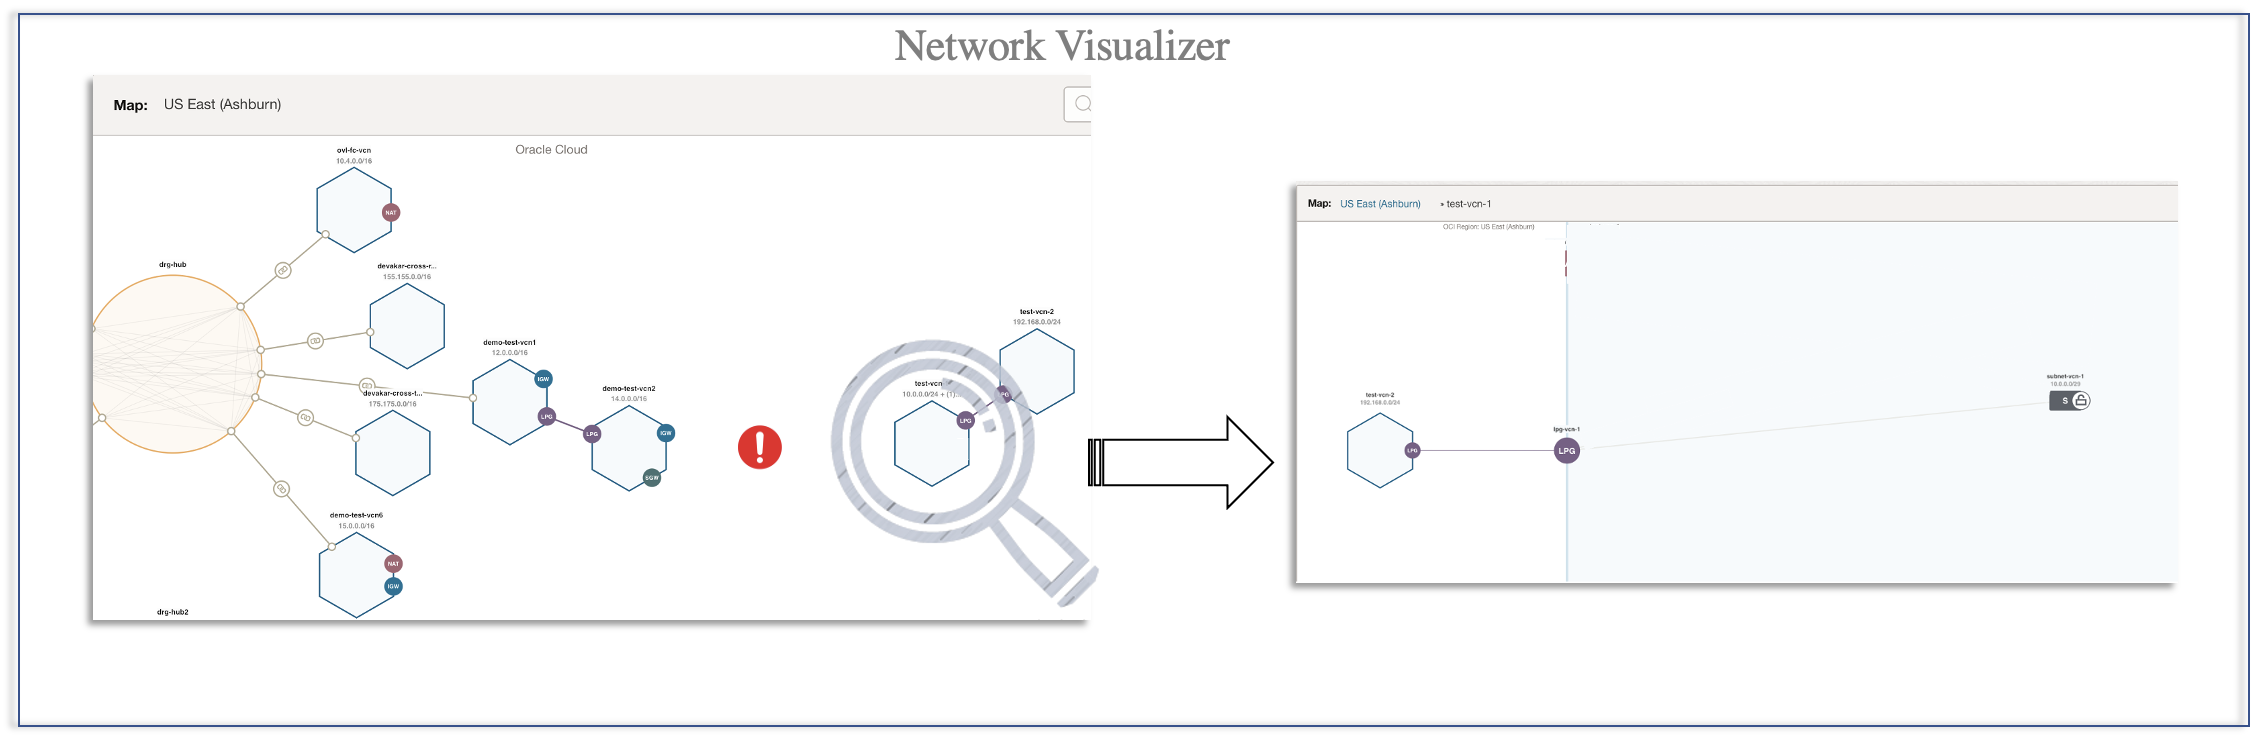
Immediately, you can see that the ordering application is in a subnet that’s disconnected from everyone else, which is an easy fix.
Now, you check your messages. The team in Australia can’t reach the customer application. You know from the Network Visualizer that the customer application is in a connected subnet, and no one else mentioned having this issue. So, it’s likely a reachability problem specific to the team in Australia.
You bring up the Network Path Analyzer in the Console. With the Path Analyzer, you can diagnose the reachability between any two points. You pick the Australian office and the customer application as endpoints.
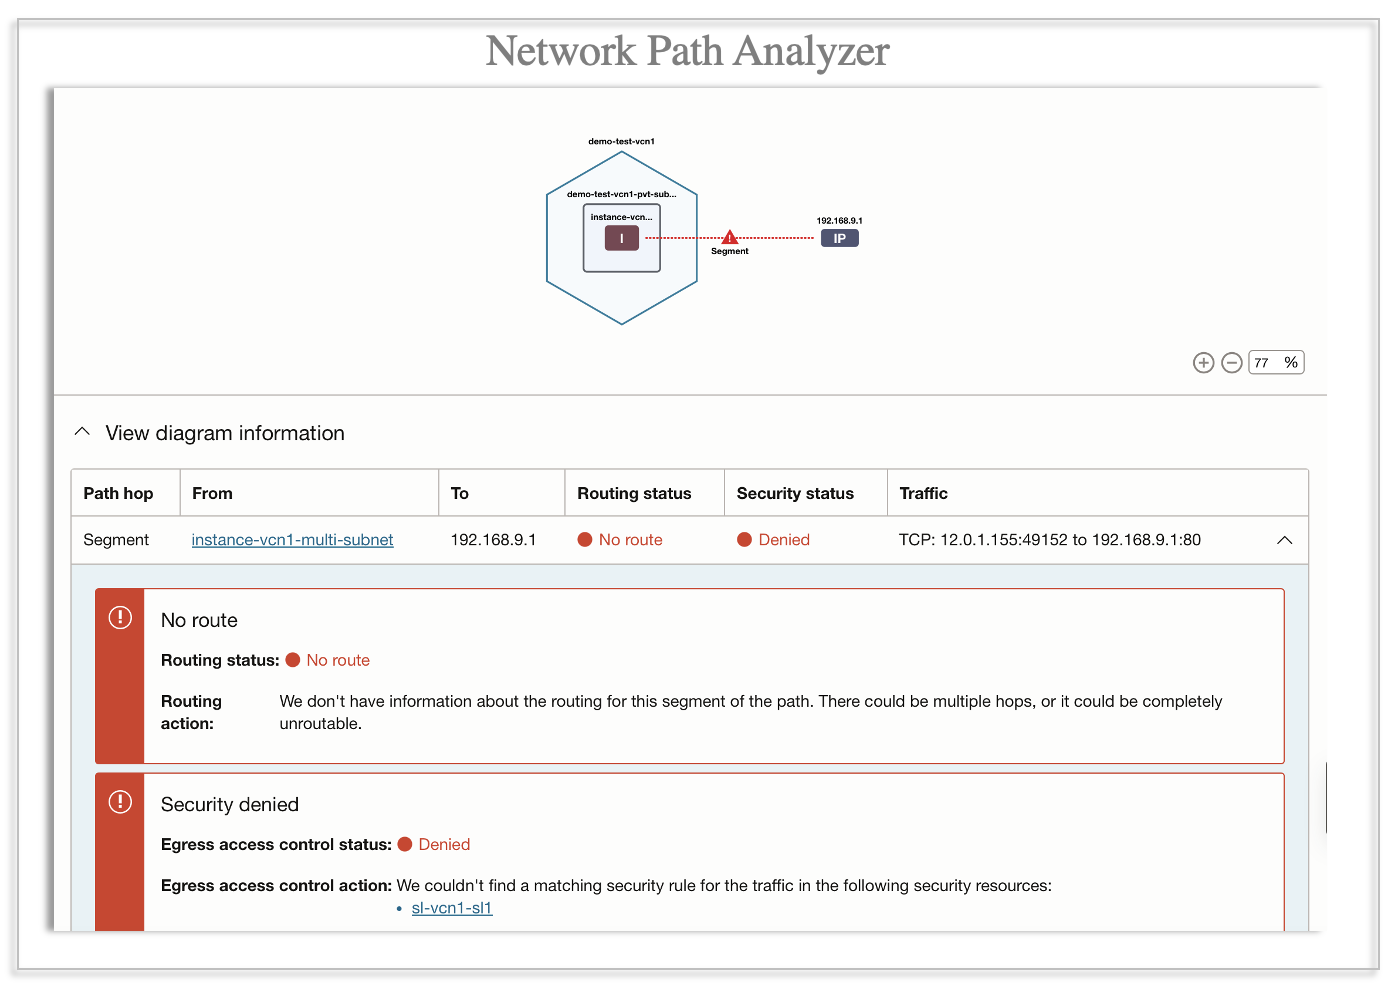
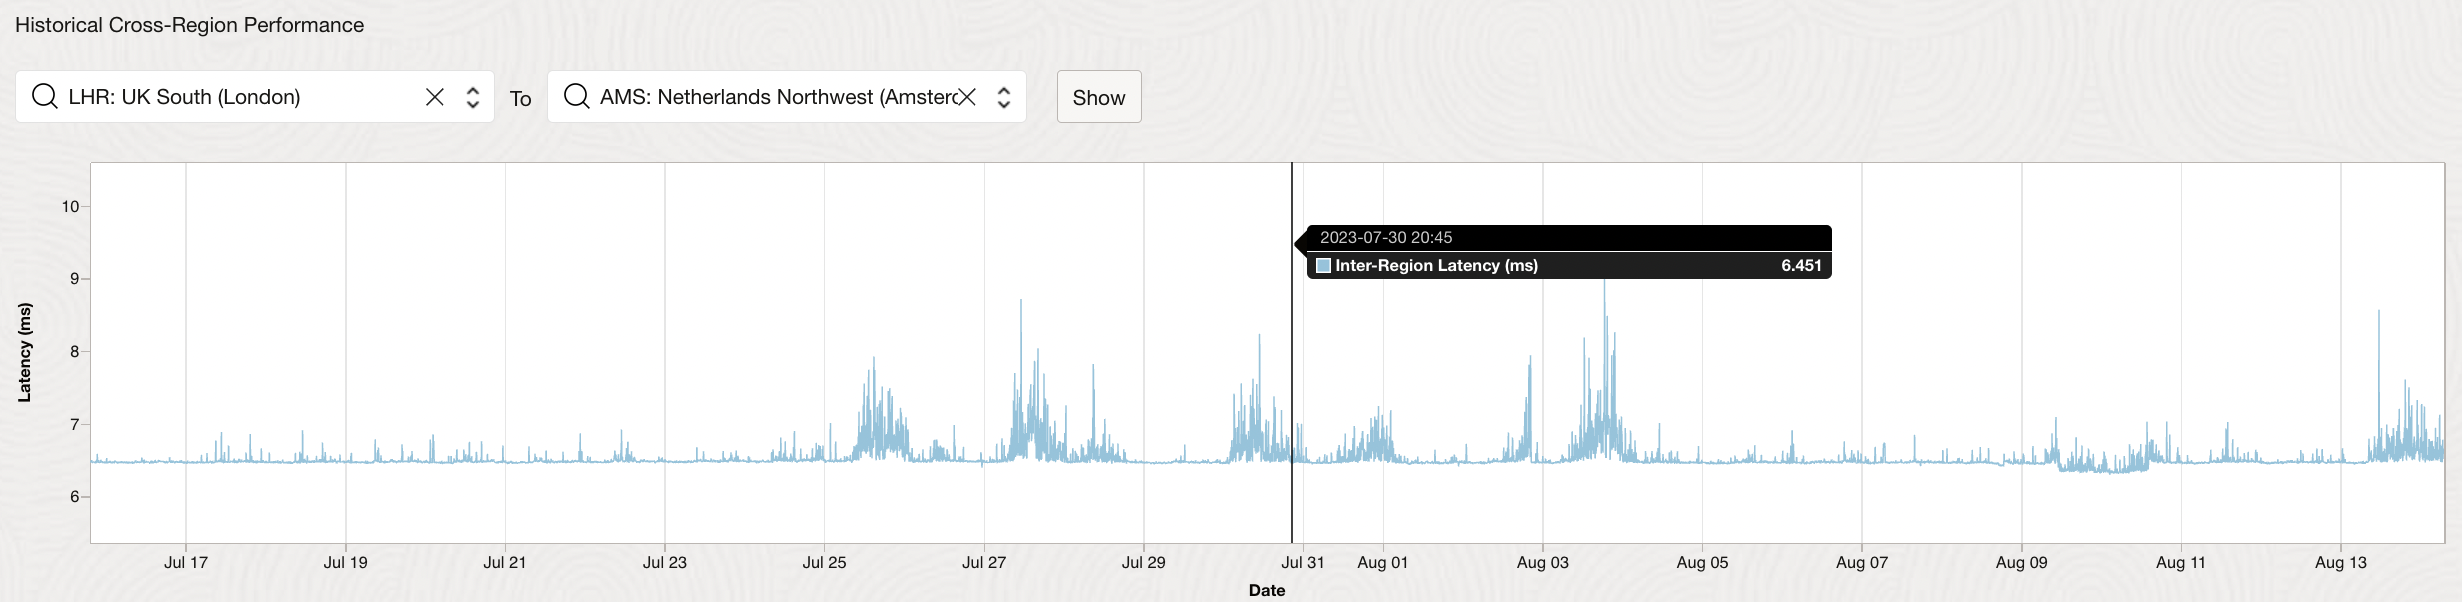
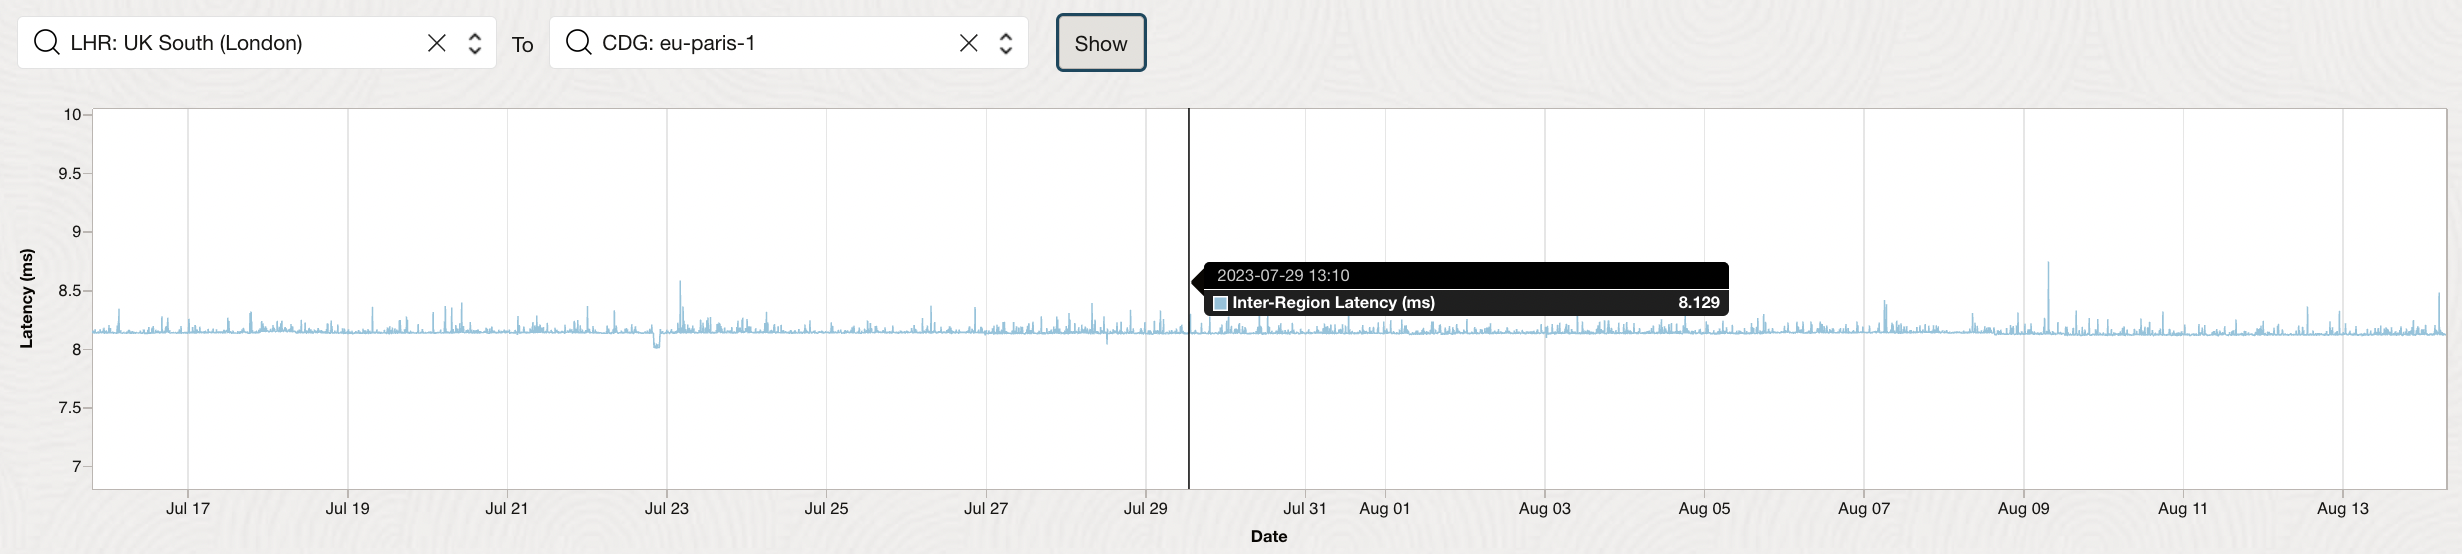
Sure enough, you can’t get there from here. You have a missing routing and security policy. As a side note, you also see a request from the London office to shortlist some suitable disaster recovery sites to pick from within Europe, considering network performance and latency considerations between the London and the disaster recovery site. With the interregion latency dashboard, you get to review real-time and historical latency trends between any two OCI regions. Based on interregion latency trends between London and other regions within Europe, you recommend Amsterdam and Paris as potential disaster recovery site candidates to the London office.
You’ve cleared out issues on your plate so far, but the operations team brings a new and interesting problem up to you. System updates in Singapore have been failing. It hasn’t been a high priority issue so far because the update process just keeps retrying on its own, but it’s failed for a week now and merits attention. These updates have been scheduled to kick in late every night. So, you set up flow logs for the Singapore network to review what’s happening over night and leave the office for the day.
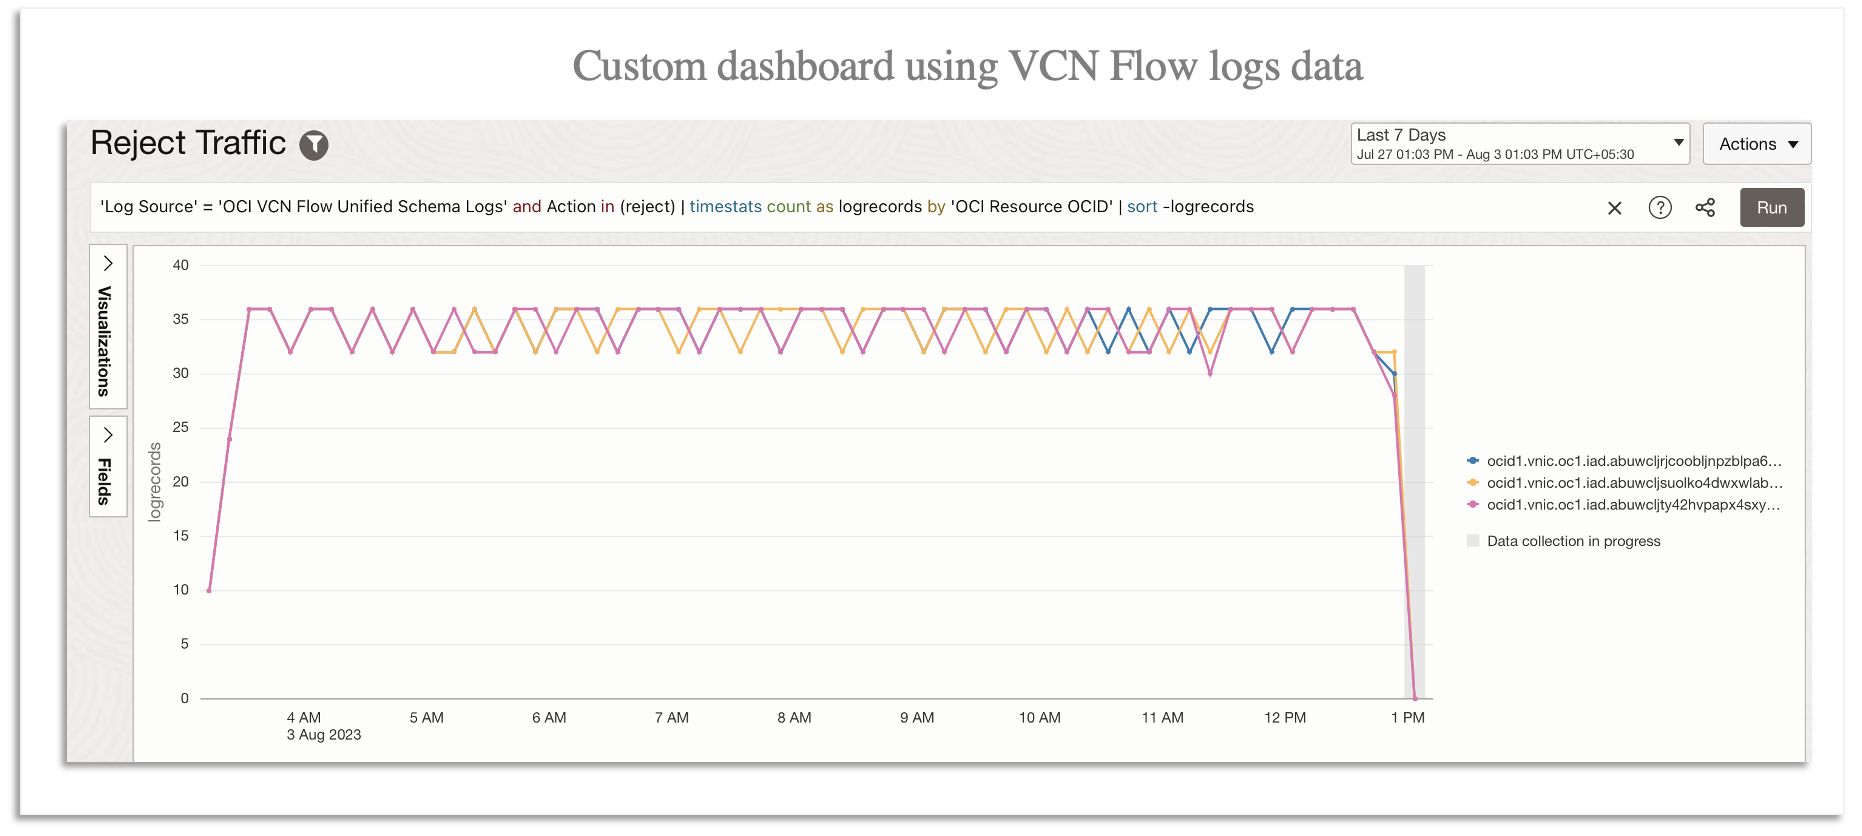
The next morning, you review your flow logs dashboard to figure out that only the update traffic is being rejected, while the rest of the network traffic is going through fine. You look a bit deeper at the network configuration and find a mistake in a security policy that’s affecting the update traffic. Again, now that we identified the issue, we can easily fix it.
Conclusion
For advanced troubleshooting, you can also investigate the network traffic at a particular point, such as the network interface, through the VTAP. VTAP helps mirror traffic from a network resource for deeper inspection and analysis. If you’re familiar with WireShark or any other packet analyzer tool, VTAP traffic can feed into this tool.
For proactive network health and performance monitoring, you can set up alerting thresholds for the metrics of interest across resources in your network environment, such as network interfaces, load balancers, DRGs, FastConnect, and VPNs. You can receive notifications whenever the metrics show signs of performance degradation, enabling you to proactively take care of potential issues before they impact end users.
Our network monitoring toolkit offers everything you need to plan, see, measure, and diagnose your cloud network infrastructure, and help meet the complex hybrid multicloud connectivity needs of your users and applications. For this and many reasons, customers are choosing Oracle Cloud Infrastructure.