A customer’s most vital cloud resource is their Compute instance. Selection of the right cloud compute resource is often based on the results of CPU benchmarks. This blog post starts with a customer observing an anomaly in their benchmark test. This anomaly came not from a flaw in the instance under test, but from applying a standard benchmark test design to complex architecture that required a more tailored benchmarking approach.
This is the first entry in Behind the Scenes posts highlighting cloud benchmarking issues that we’re calling, Under the Bench. Behind the Scenes: What lies beneath your benchmarks? Explains the need for these entries, which are intended to help users navigate the trickier aspects of benchmarking for better cloud efficiency.
On our journey to understanding this anomaly previously mentioned, we’ll need to cover the underlying architecture of simultaneous multithreading (SMT) feature on CPU workloads and how it affected the benchmark results. We delve into how software thread scalability in the test interacts with SMT, causing the observed anomaly and present a cheat sheet for how to factor in SMT into benchmark test design.
Hyperthreading or SMT is a well-understood topic and covered extensively. However, this post shows the relevance of cloud customers applying these concepts to their benchmark evaluation. Readers with a firm understanding of SMT can skip the next section and start reading from the Cloud Compute Evaluation section.
Simultaneous multithreading
SMT is technique that shares a single core between two threads. Two logical threads can work through tasks more efficiently than a traditional single-threaded core. By taking advantage of idle time when the core is normally waiting for the current task to complete, SMT improves CPU throughput. A simple representation of SMT is shown in Figure 1. It shows that each core uses only one thread with SMT disabled and two threads per core when SMT is enabled.
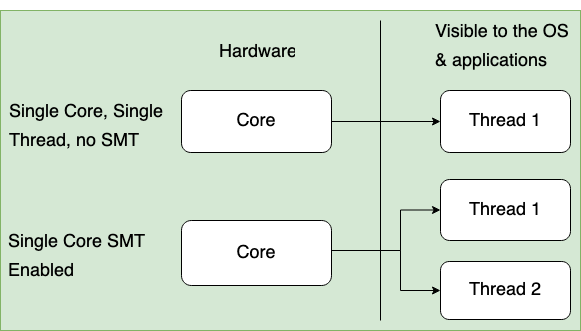
Figure 1: Simultaneous multithreading
The CPU core is made from subcomponents, which distribute work among themselves to provide a fully functional CPU core. Looking through an architectural lens, the components consist of the following parts:
-
Arithmetic and logic unit (ALU): Responsible for carrying out arithmetic and logical operations
-
Floating point unit (FPU): Responsible for carrying out floating point operations
When a core has two threads, the components are shared.
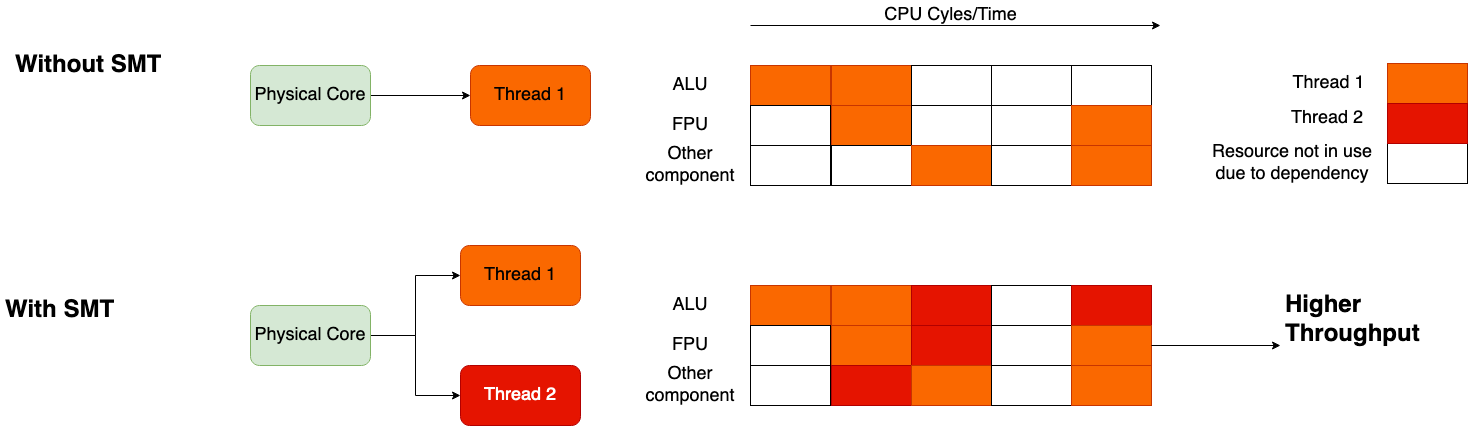
Figure 2: Comparing CPU throughput with and without SMT
Figure 2 shows a pipeline of CPU components (ALU, FPU, and other components) and their availability through time. The cells in the pipeline illustrate the core’s cycles as time progresses. The lower pipeline in Figure 2 indicates how SMT can utilize otherwise empty resource cycles (white boxes) to achieve higher throughput. These SMT-enabled cores allow components to execute the work of a different thread instead of being idle. From a benchmarking point of view, a CPU-intensive benchmark running on the core with two active threads can cause contention for these units, and the total performance depends on how these resources are shared.
The throughput per thread (not per core) is lower than the benchmark running on a core with just one thread active. The aggregate throughput of the two threads per core exceeds 100% by using SMT. Standard literature shows that for common workloads with SMT each thread can achieve 65% throughput, but these numbers can vary depending on the workload.
Now you can see why we said not all CPUs are equal. When we ask the scheduler for a CPU to run our thread, we can get an underlying core that might or might not have an idle sibling. The only way to know which one you’re going to get is by knowing how many CPUs are already occupied on the system.
Now that we’ve covered the fundamentals of SMT, let’s see how SMT was involved and how certain assumptions about its functionality led to anomalous results. Let’s start by covering the customers evaluation strategy and how the benchmark works.
Cloud compute evaluation
Evaluation synopsis
The customer was evaluating OCI’s compute resources through a CPU intensive benchmark test. The expectation was that CPU performance would scale linearly as the number of threads increased. As mentioned in the introduction, when the customer ran the benchmarks, they were surprised with the anomalous results they received. The anomaly was reflected in a large standard deviation in the aggregate CPU throughput as the number of threads increased. A high variance in CPU throughput results raised questions about the stability of OCI compute performance in the customer’s eyes. To ascertain the true root cause, we demonstrate the troubleshooting methodology used to explain the anomaly’s cause and recommend a solution.
Evaluation strategy and criteria
The customer selected the sysbench cpu benchmark, which offers a comprehensive suite of tests designed to evaluate CPU performance, thread handling, mutexes, file IO, and various online transaction processing (OLTP) workloads. With the ability to run in parallel using multithreading, sysbench cpu provides valuable insights into the performance of their chosen cloud instance. Our customer’s intent for this benchmark test was to isolate and evaluate for CPU throughput only.
Sysbench cpu computes prime numbers and is configured with an upper bound on the number of prime numbers to be computed within a specified time range. Each successful aggregate computation of prime numbers to reach the upper bound is recorded as an event and the throughput of each thread is measured by counting the number of such events. The benchmark then collates this data from repeating the same test multiple times to provide statistical information, such as the average events per second, aggregate events, standard deviation, and other statistics.
It runs the same benchmark in parallel on each software thread. The assumption then is that each of these threads will be scheduled on a CPU by the operating system for best results. In this case, the customer chose an instance type with four CPU cores and the benchmark tested the scalability of the workload as the underlying CPU resources were scaled. The underlying assumption was that providing more physical resources (CPUs) to the workload would result in linear increase in throughput for the workload.
Summary of the results
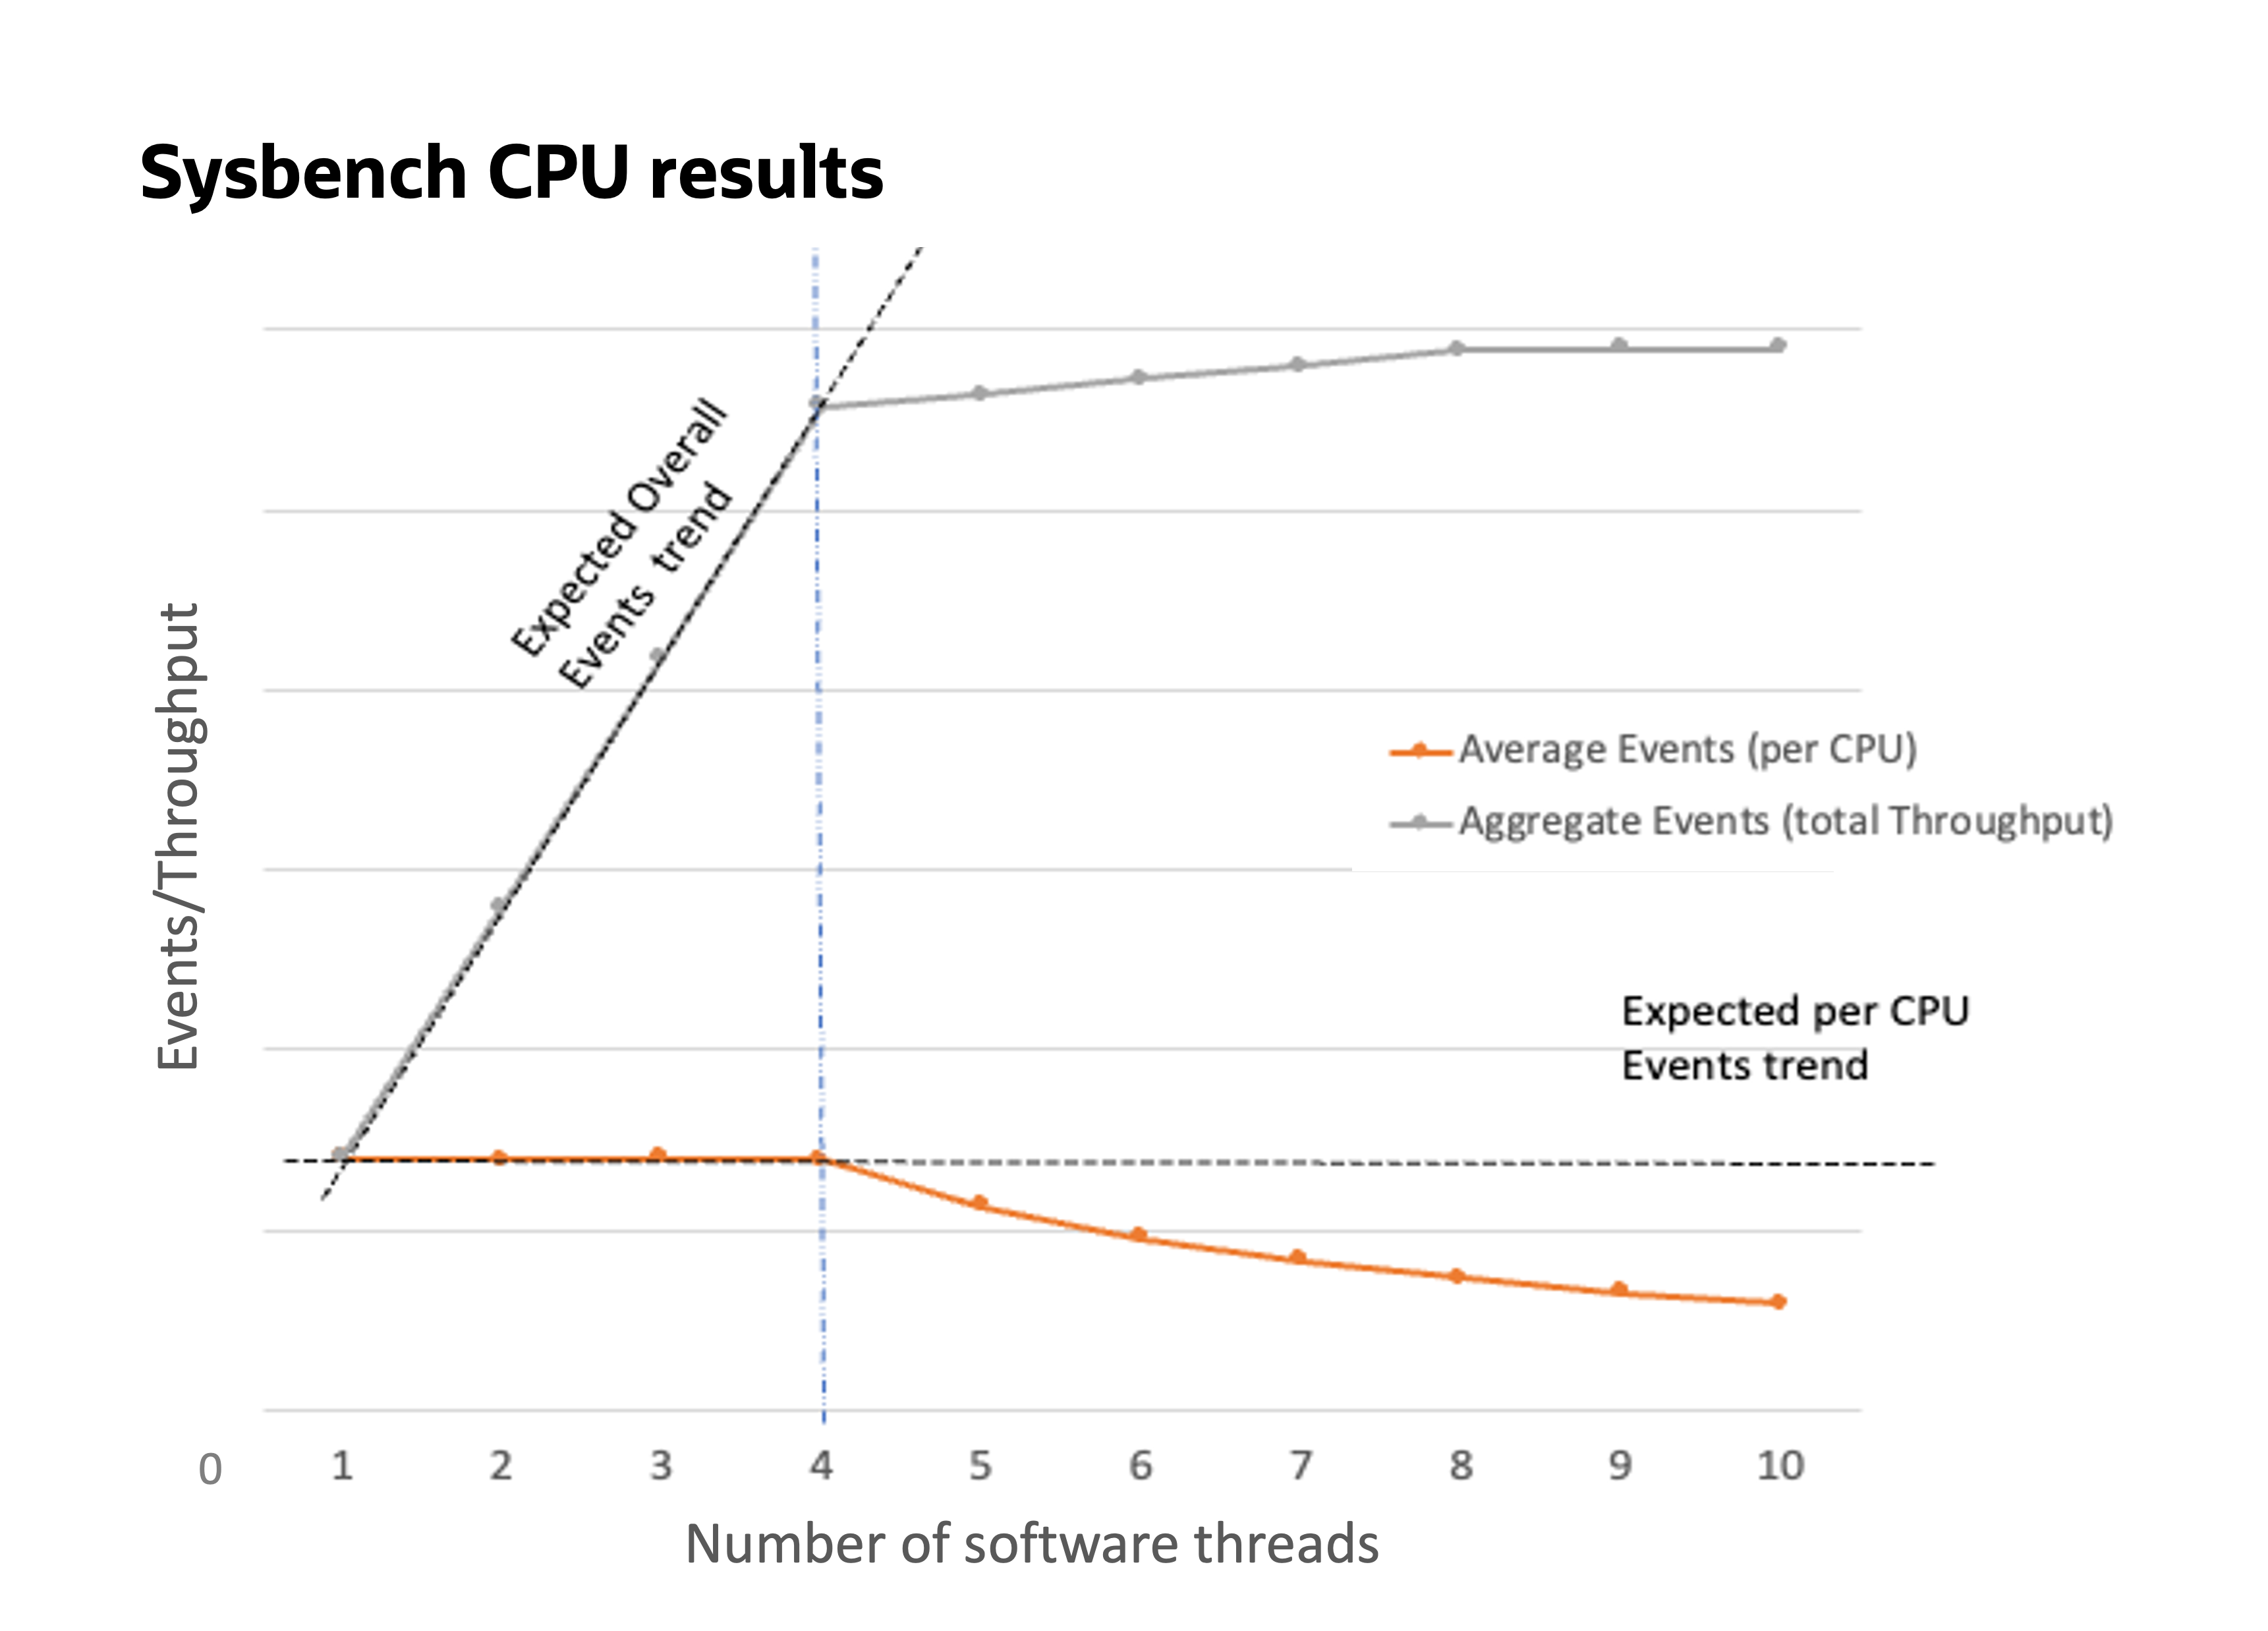
Figure 3: Graph of sysbench cpu benchmark results
The graph in figure 3 shows the results of sysbench cpu with the average events per second and aggregated events for a run, spanning 1–10 threads on a four-core instance. The dotted trend lines show the expected results by the customer, where the overall aggregate events continue to grow linearly, and the average events per CPU remain steady. However, the actual results were contrary to this expectation, as highlighted in Figure 4 (to the right of the vertical line). The trend shows the following information:
-
As the number of threads increase, the aggregate events scale up to the number of cores (in our case, four) and don’t continue to grow linearly, eventually saturating (in our case, eight, which is the number of cores times the number of threads per core).
-
The average events per second increase slightly up to number of cores, drop, and don’t stay steady. This trend occurs because as we saturate on aggregate events and increase the number of threads, so the average comes down.
Table 1 shows the summary of the results of running the benchmark. The number of cores and total hardware threads or threads per core (TPC) in the underlying instance chosen are constant and shown. The benchmark provides an average value of number of events per software thread, total aggregate number of events, and the standard deviation of the events.
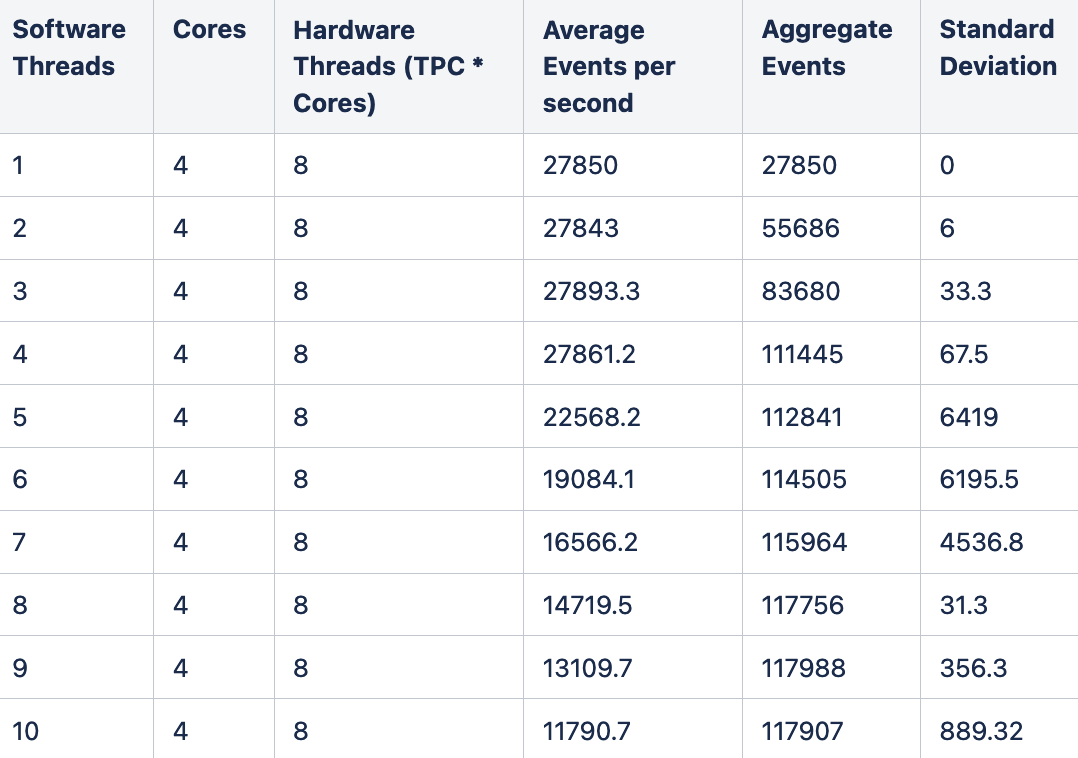
Table 1: sysbench cpu benchmark test result summary
Table 1 shows wild swings in the standard deviation values. Typically, high values of standard deviation indicate a problem. Let’s dig deeper to see the standard deviation in detail by plotting it on a graph. We split the standard deviation of the sysbench cpu benchmark into separate scenarios to help understand what’s going on.
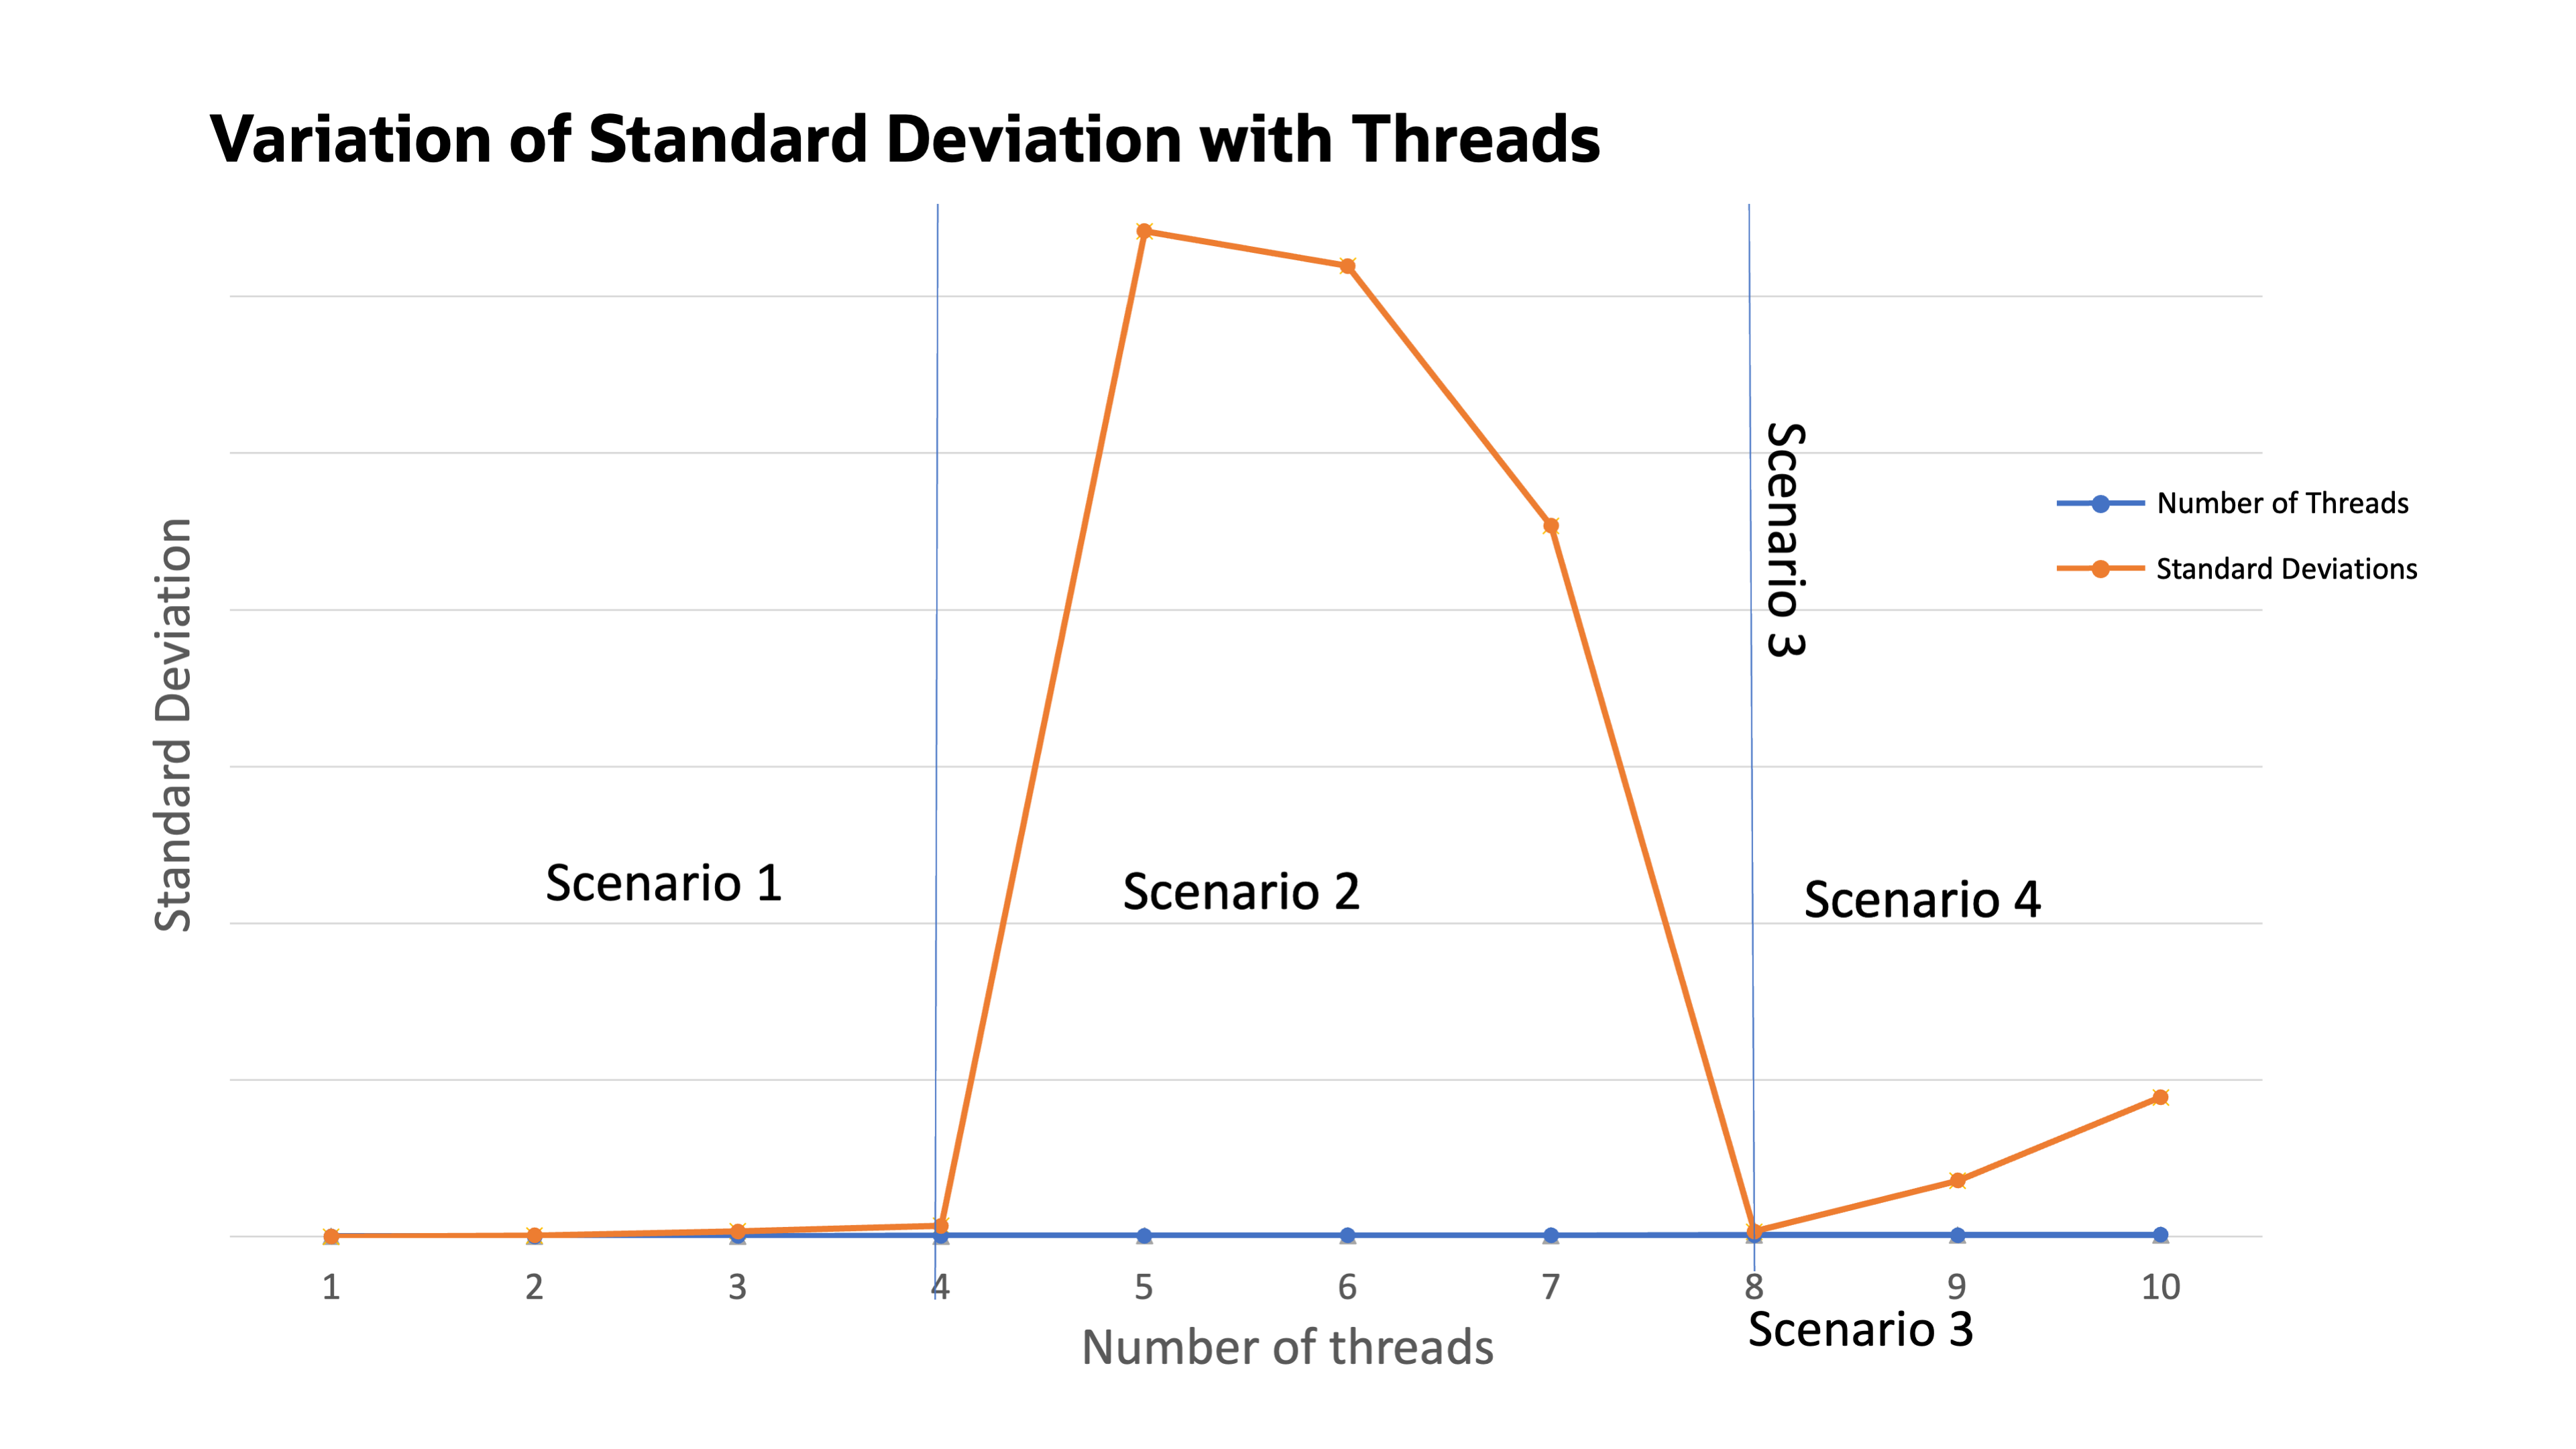
Figure 4: Standard deviation of sysbench cpu benchmark for 1–10 threads
As we scale the number of software benchmark threads, we observe that between 5–7 threads, the graph becomes hyperbolic with a large standard deviation. This variation isn’t the uniform scalability the customer expected as outlined in their key performance indicator, implying that aggregate event throughput goes up uniformly and the standard deviation of events is low.
To explain the strange standard deviation, we split the diagram into separate scenarios.
Scenarios
Looking at the diagram, we observe that the benchmark exhibits the following scenarios:
-
Scenario 1, underloading: Low standard deviation initially with low number of software benchmark threads, up to the number of cores on the machine (four).
-
Scenario 2, mixed loading: A strange jump in the standard deviation as the software benchmark threads are scaled from 5–7.
-
Scenario 3, full loading: A drop in standard deviation returning to a low value when the number of software benchmark threads is 8.
-
Scenario 4, overloading: A gradual rise in standard deviation when the number of software benchmark threads are increased beyond 8.
The following table illustrates these scenarios, where the benchmark is run with a different number of software threads. The setup in Table 2 describes how many software threads are run and how the scheduler allocates the hardware threads to meet the demand of the software threads. The summary section reviews the respective levels of standard deviation and the reasoning behind those results.
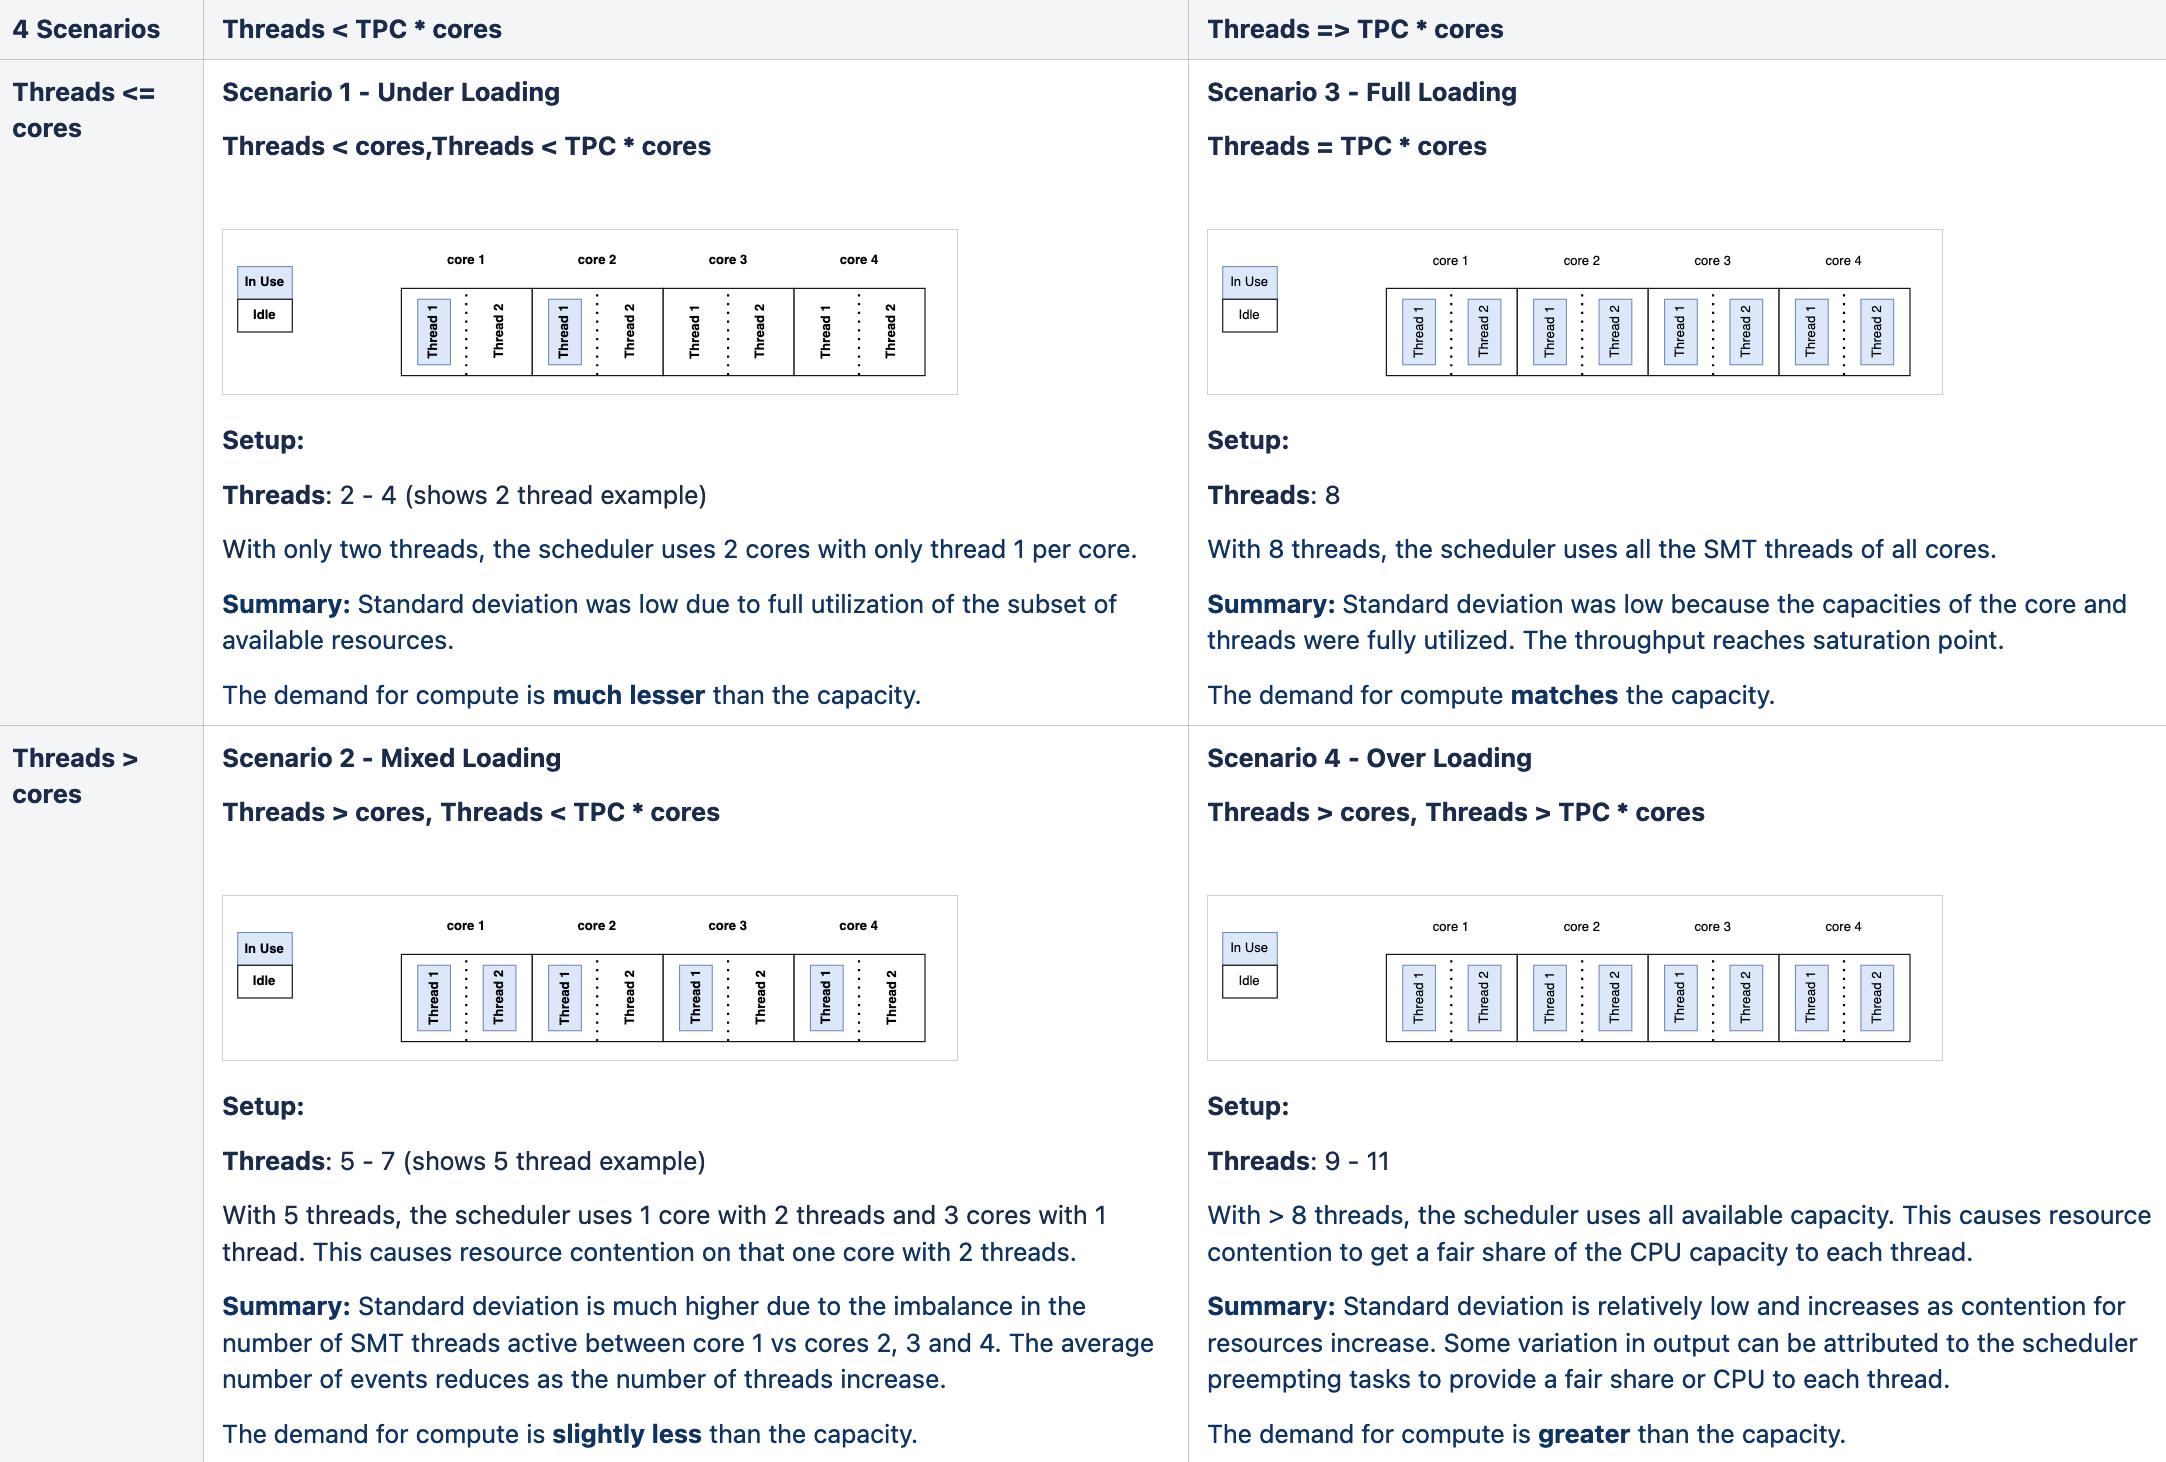
Table 2: Various scenarios encountered in the run of sysbench with varying number of threads
These four scenarios from Table 2 explain the variance in the output in Table 1 and Figure 5. The aggregate events and standard deviation depend on how the system cores and the corresponding SMT threads are loaded. The performance varies based on how many SMT threads are used. When we explained these results to the customer, they were happy to learn that the anomaly wasn’t caused by a fundamental issue with the instance type. These results demonstrate the importance of understanding underlying system architecture.
Cheat sheet for SMT
The sysbench cpu isn’t the only benchmark used for evaluating hardware, but we can apply the results when evaluating other CPU intensive benchmarks. Based on our observations, use the following best practices to run the benchmark on SMT enabled CPU:
-
Cover all cores incrementally one by one, and then cover all SMT threads when scaling the benchmark threads, which typically means using an even number of threads. Scale with a factor of two or multiply the number of threads by a factor of two with every iteration. We scale the benchmark software threads from from 1 to n (where n is the number of cores) and then 2n, 4n, 8n, and keep doubling until we reach our desired parallelism value for number of threads. This scaling ensures no mixed loading of cores (as in scenario 2).
-
When considering CPU capacity, use full cores for computing the baseline CPU performance. Our tests show that the throughput starts to saturate when the number of sysbench threads reach the full core count for CPU intensive workloads.
To generalize benchmark CPU testing beyond CPU intensive use case, we can use the following decision tree to design benchmark test when using SMT:
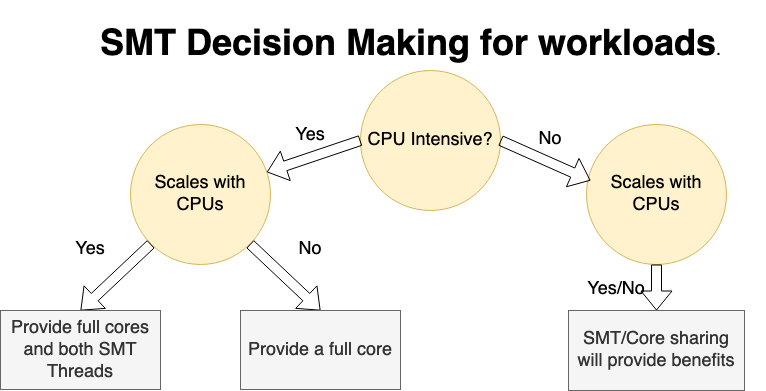
Figure 5: SMT decision diagram for workloads
This decision diagram can help you decide how to share a core or a set of cores based on the nature of the benchmark or workload and shows the following information:
-
Workload benefits from SMT sharing across different tasks: If a workload isn’t CPU intensive, it’s a good candidate for sharing the core with workloads that can run on the sibling SMT threads.
-
Workload doesn’t benefit from SMT sharing across different tasks:
-
If a workload is CPU-intensive and doesn’t scale with the number of CPUs, it can benefit by using a full core. In this case, SMT sharing might hinder performance.
-
If a workload is CPU-intensive and scales with the number of CPUs, allocating both the SMT threads of a core to it benefits it.
-
If SMT introduces challenges, should we disable SMT?
We don’t recommend disabling SMT because it can hinder overall performance and reduce the level of parallelism or the number of virtual CPUs available. However, if benchmark consistency is key, consider disabling it for running a CPU-intensive benchmark like sysbench cpu. The decision to disable must be made based on testing the actual workload and not just the benchmark. High-performance computing (HPC) applications might benefit from disabling SMT, but evaluate on a case-by-case basis. Only disable SMT with full evaluation of the implications.
Conclusion
Understanding the system architecture of SMT, and designing the benchmark test appropriately prevents the anomaly in the benchmark results. The OCI engineering team presented the analysis of results and demonstrated that the inconsistent results occur when CPU cores are allocated threads inconsistently between test iterations. Although SMT is a well-known topic, understanding it thoroughly and designing right benchmark test is still relevant for cloud customers. OCI engineering teams provide in-depth support to enable customers utilize their cloud resources more effectively. When running a benchmark to evaluate CPU performance, consider the following takeaways:
-
Not all CPUs are equal: CPUs work and behave differently depending on the architecture. SMT-enabled CPUs can be seen as two CPUs with different levels of performance depending on the workload and how the SMT threads are loaded. To the OS, the SMT threads are just CPUs.
-
When running a benchmark, never look at the results in isolation: In our case, we noticed that scaling the benchmark didn’t give us the numbers we expected. Evaluating results in the context of the underlying system architecture is important.
-
An anomaly in a benchmark doesn’t always imply that the resource is faulty: Always look at the infrastructure beneath the resource being measured and validate the test design as a best practice.
Armed with this knowledge, engineers can evaluate the cloud resources appropriately and identify the best infrastructure to run their applications.
This blog series highlights the new projects, challenges, and problem-solving OCI engineers are facing in the journey to deliver superior cloud products. You can find similar OCI engineering deep-dives as part of Behind the Scenes with OCI Engineering series, featuring talented engineers working across Oracle Cloud Infrastructure.
For more information, see the following resources: