We’re pleased to announce the general availability of distributed tracing for Oracle Functions with Oracle Cloud Infrastructure (OCI) Application Performance Monitoring (APM) integration. This feature enables Functions developers and operators to diagnose performance issues faster with APM distributed tracing and helps improve the observability of function invocations.
Oracle Functions is a serverless functions-as-a-service (FaaS) platform that lets you create and run event-driven business logic without managing infrastructure. With Functions, you focus on your code, while the platform handles concerns like provisioning and autoscaling. With Functions, you’re billed only for the resources consumed when the function runs.
Metrics, logs, and traces are the three pillars of serverless application observability. Functions already provides integrated metrics and logs to help developers observe and troubleshoot serverless applications. With this feature, we’re adding support for traces. Distributed tracing provides a visual representation and timeline of a request as it flows through the different components of a serverless application.
APM service provides deep visibility into the performance of applications and enables DevOps professionals to diagnose issues quickly. It provides a first-class distributed tracing platform for applications. Integrating Functions with APM extends these capabilities natively to serverless applications. This feature gives you the ability to trace and instrument individual functions and complete serverless applications. This capability helps you quickly identify and troubleshoot failures and latency issues in your Functions-based applications.
Using distributed tracing for Functions
You can now send your function trace and span data to the APM service. Enable tracing by using the toggle switch in the Functions section of the Console and select an APM Domain.
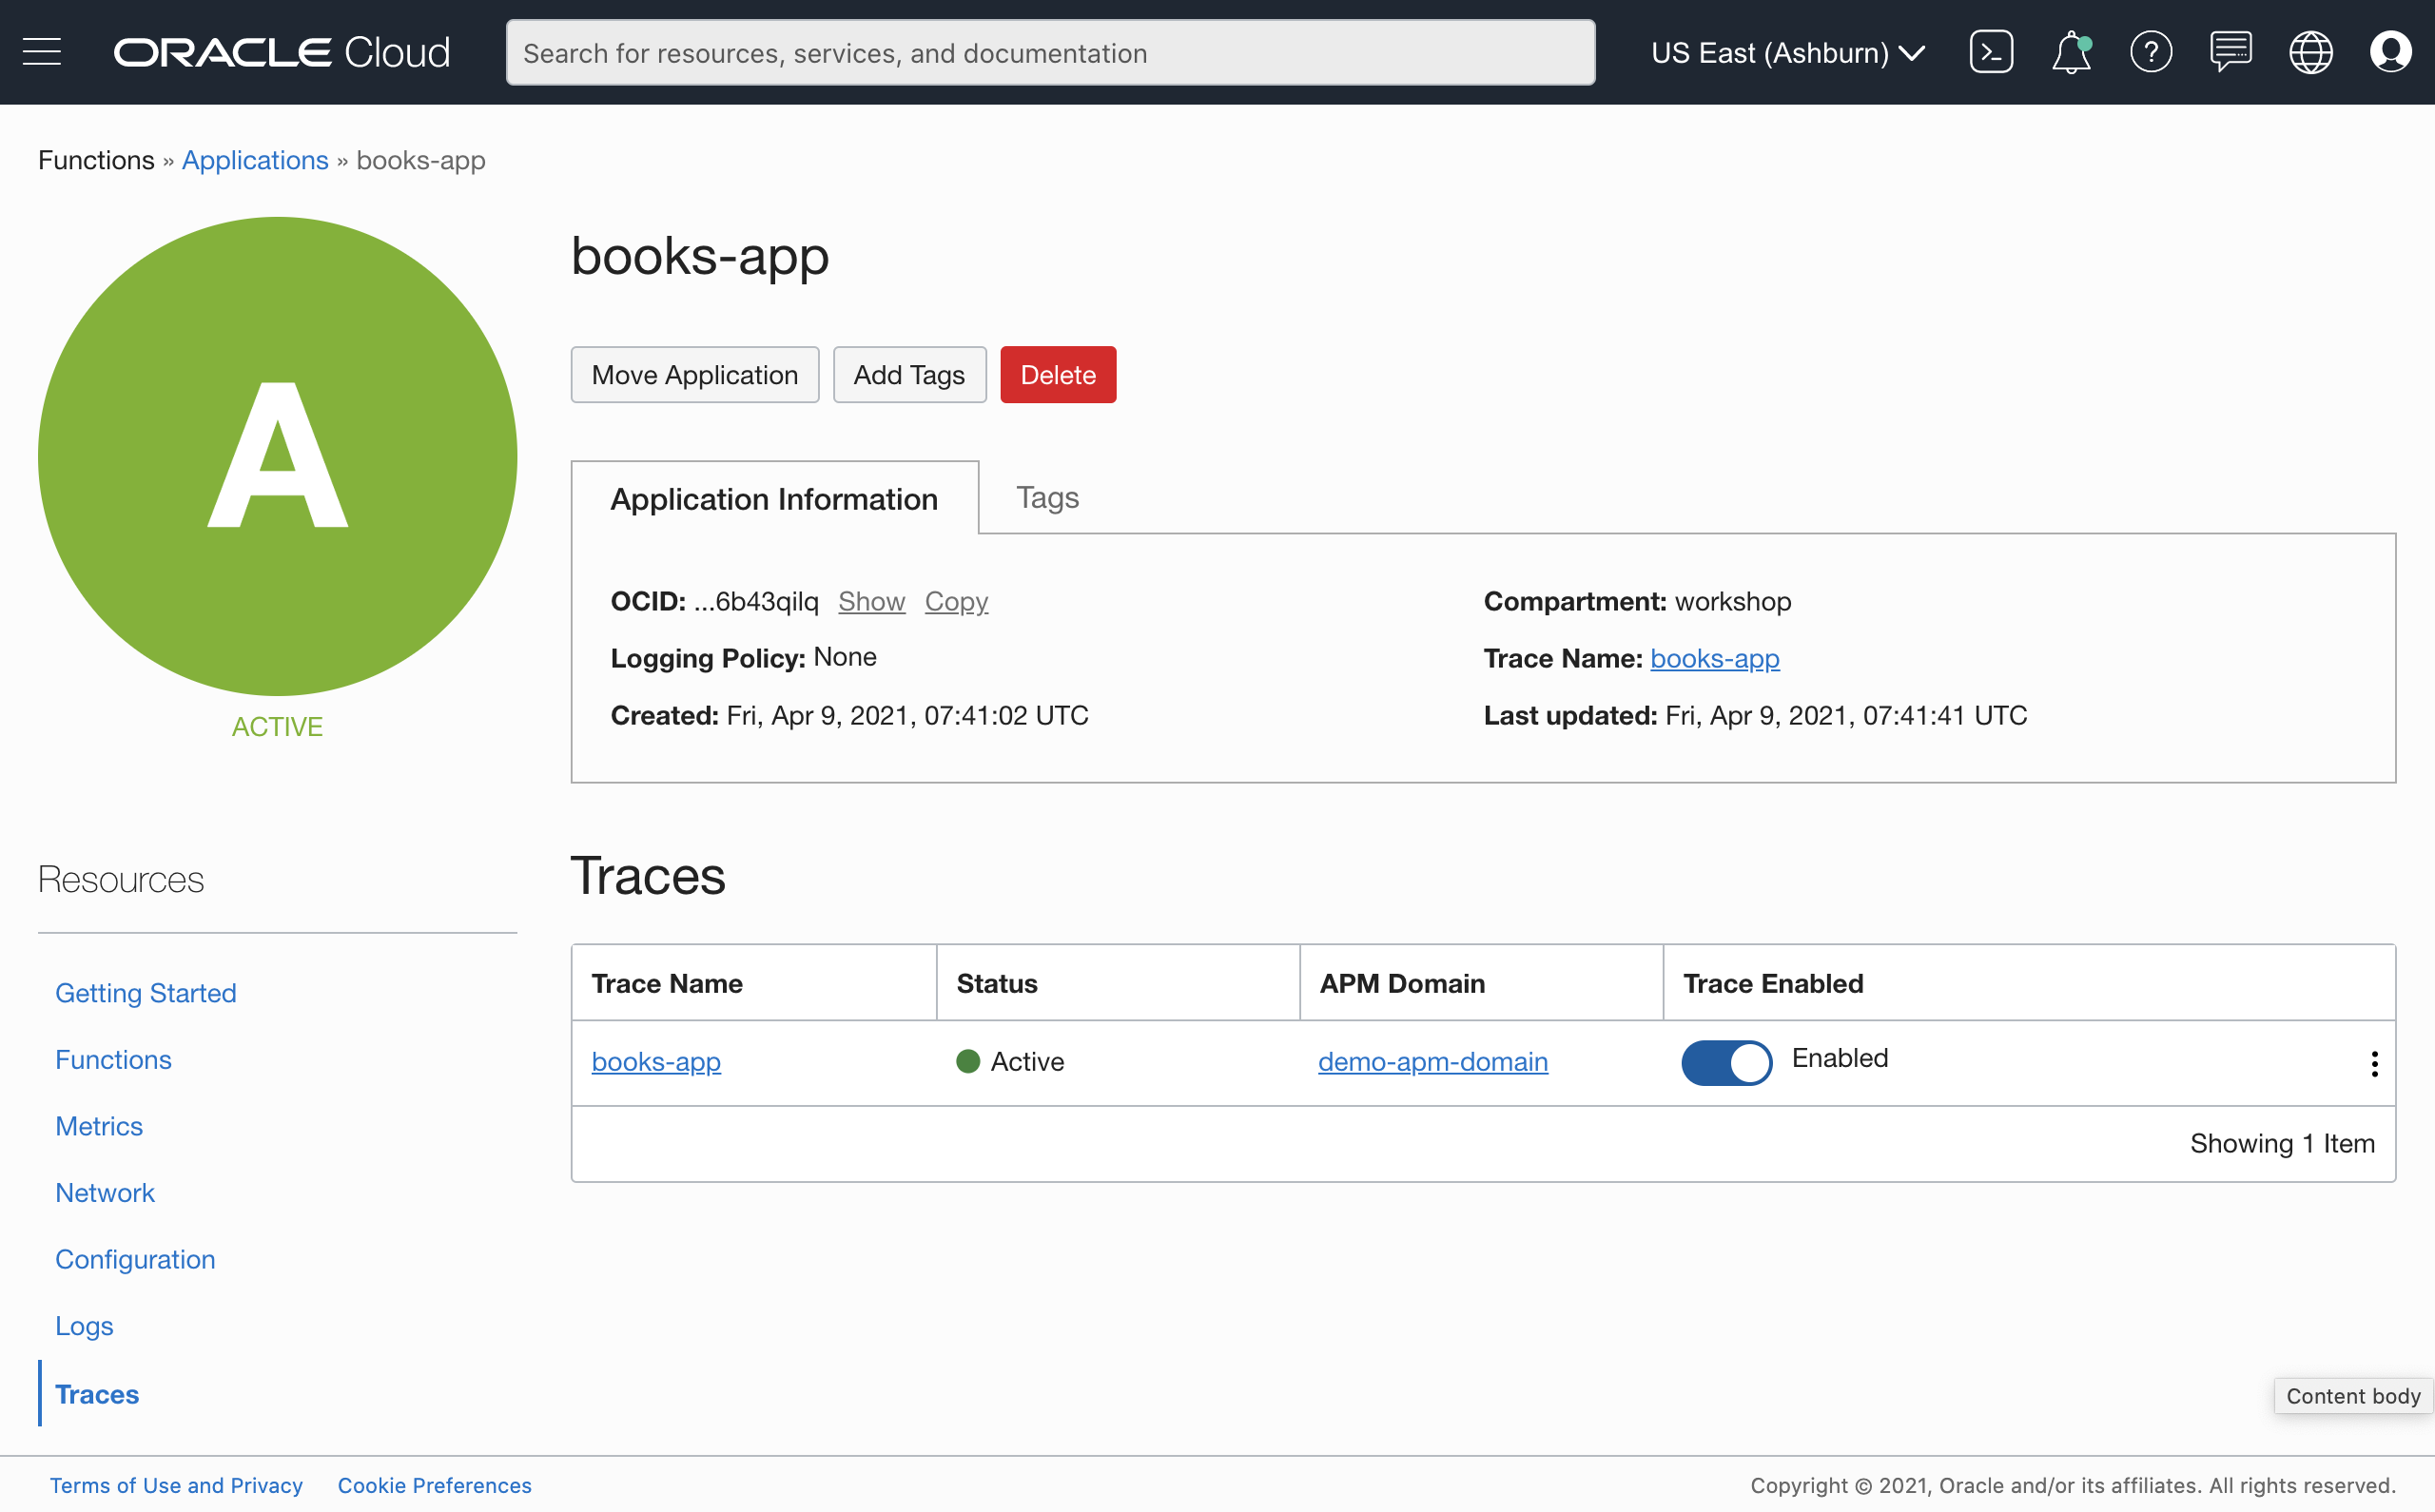
Figure 1: Tracing enabled for an application
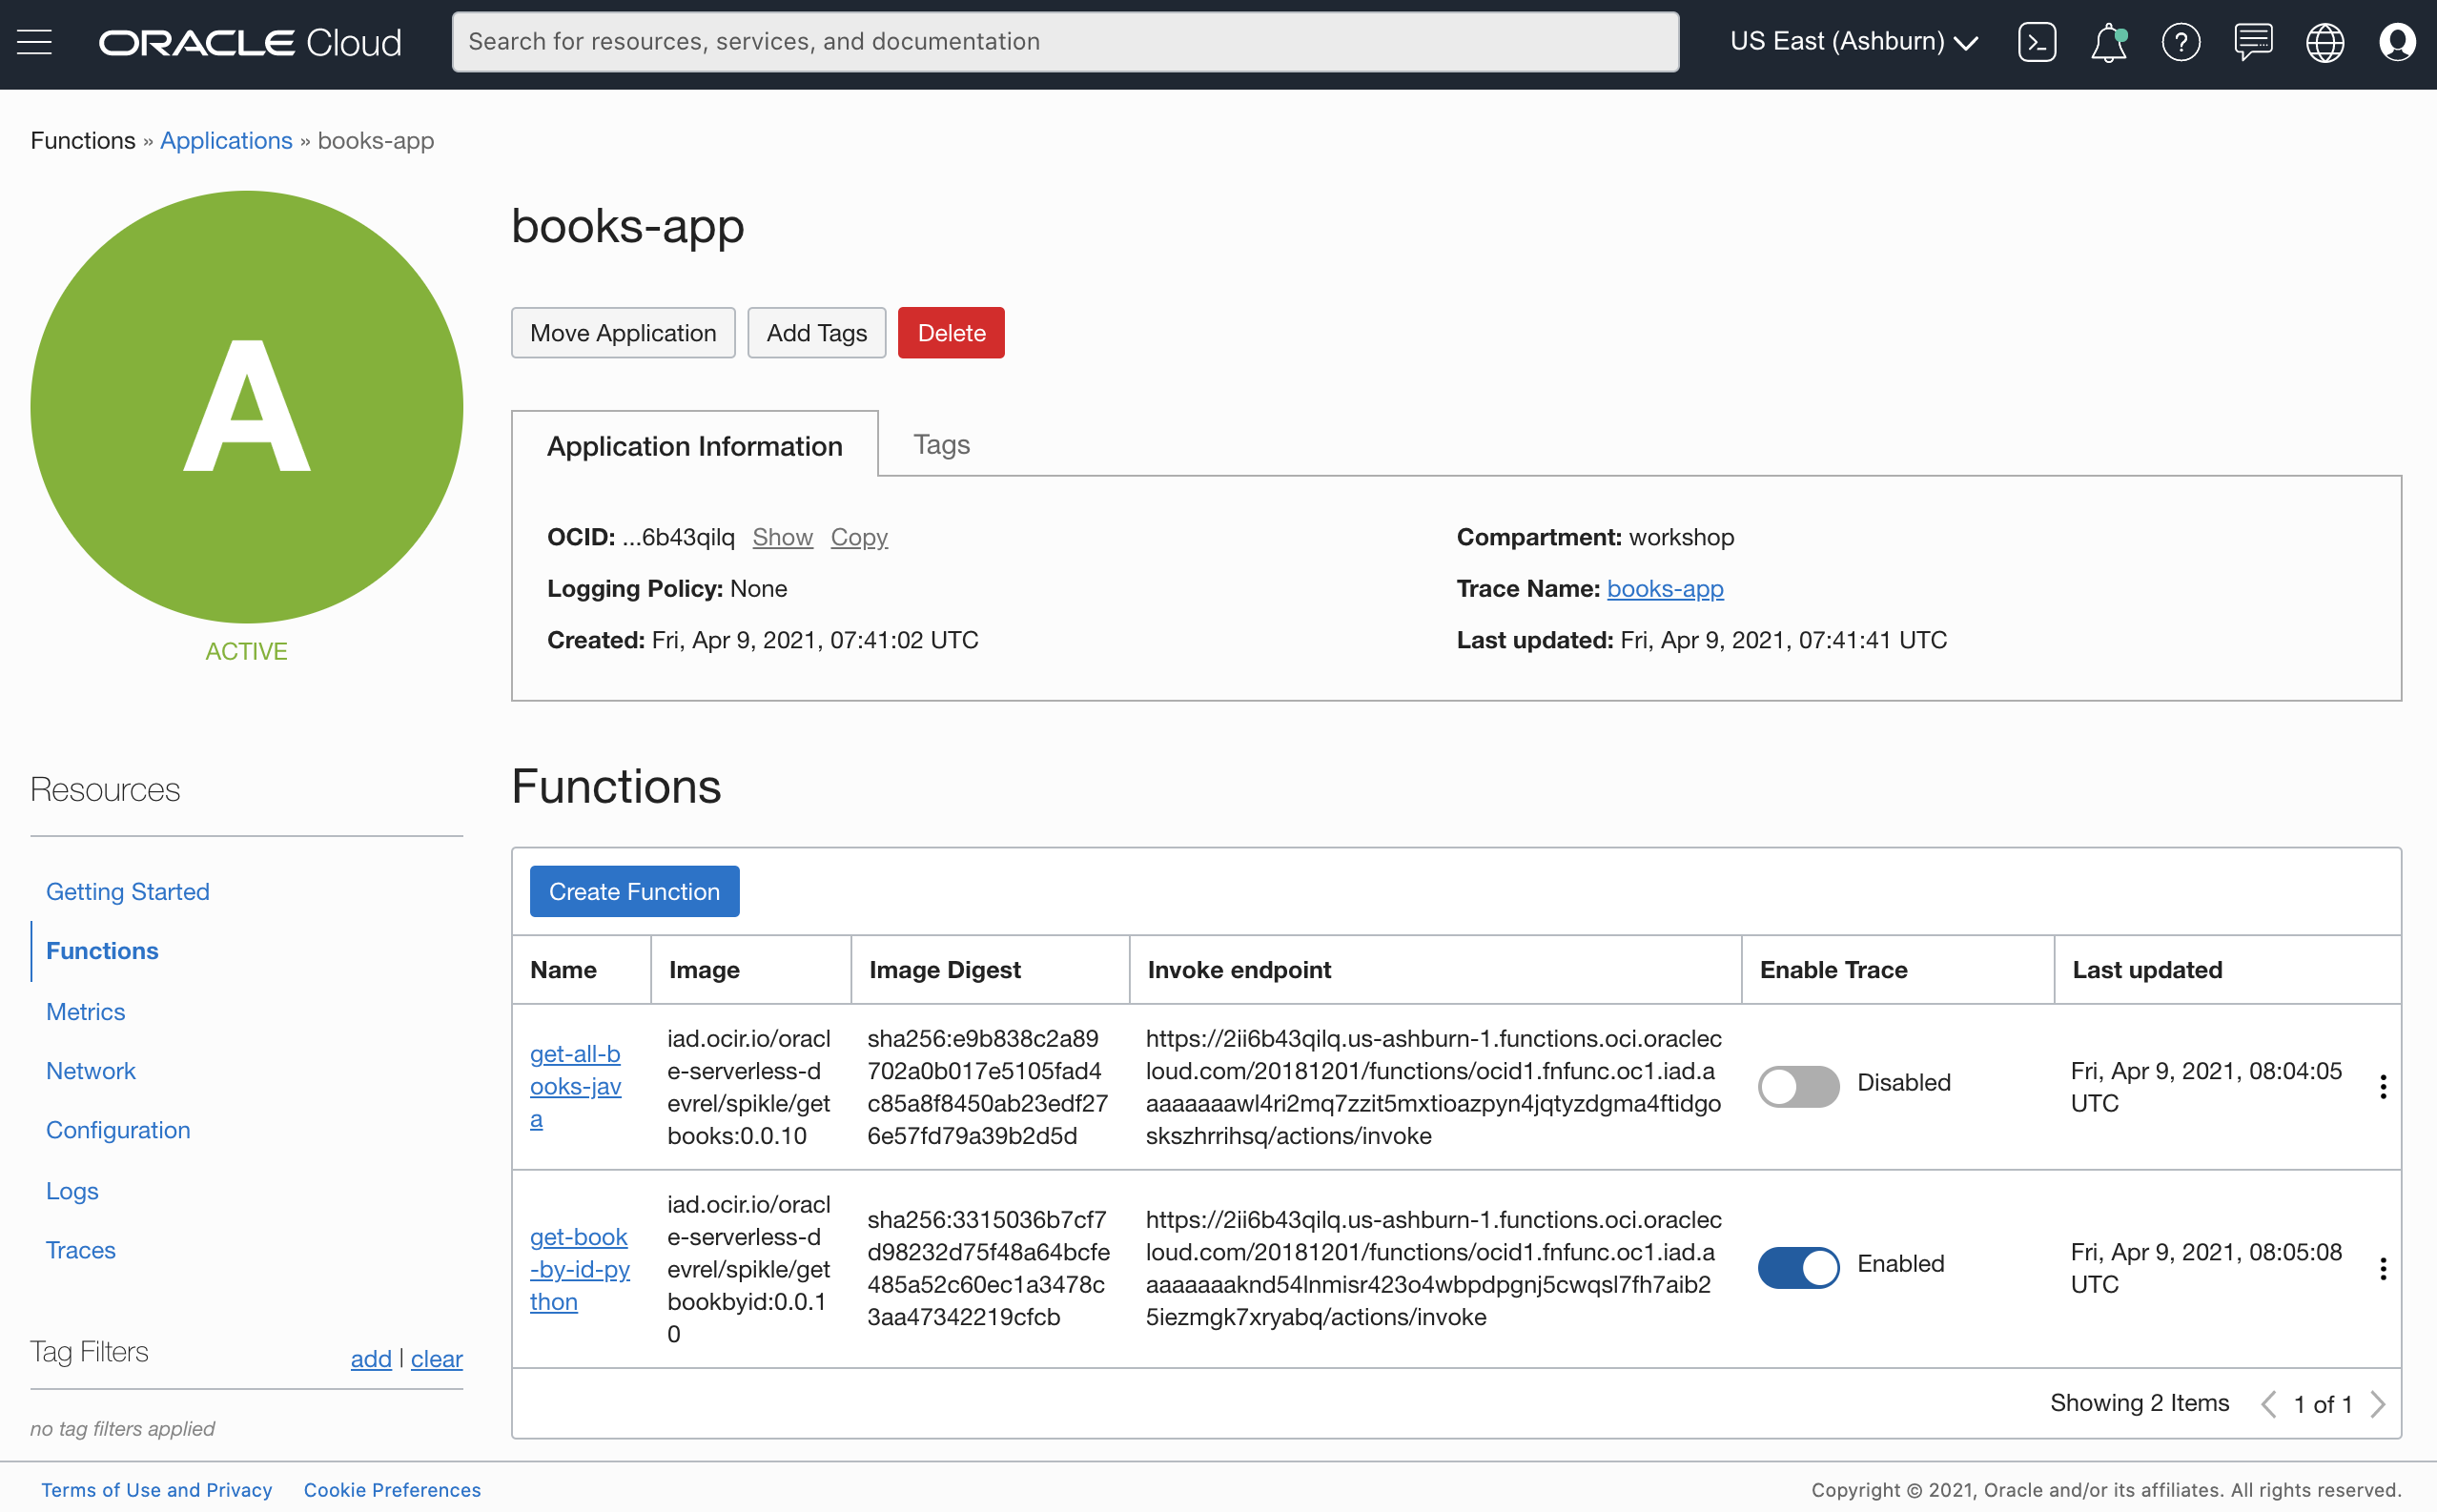
Figure 2: Tracing enabled for a function
When your function is invoked, the Functions service automatically sends a default function invocation span to the selected APM Domain, without any tracing code in your function. This default span captures the overall time taken by the Functions service, from the time it receives an invocation request until it sends a response back to the invoker, including cold start time and errors returned by the service.
To view the trace and span data, click the trace name to go to the APM Trace Explorer screen. You can explore traces and spans using an intuitive, flexible query language in the APM Trace Explorer.
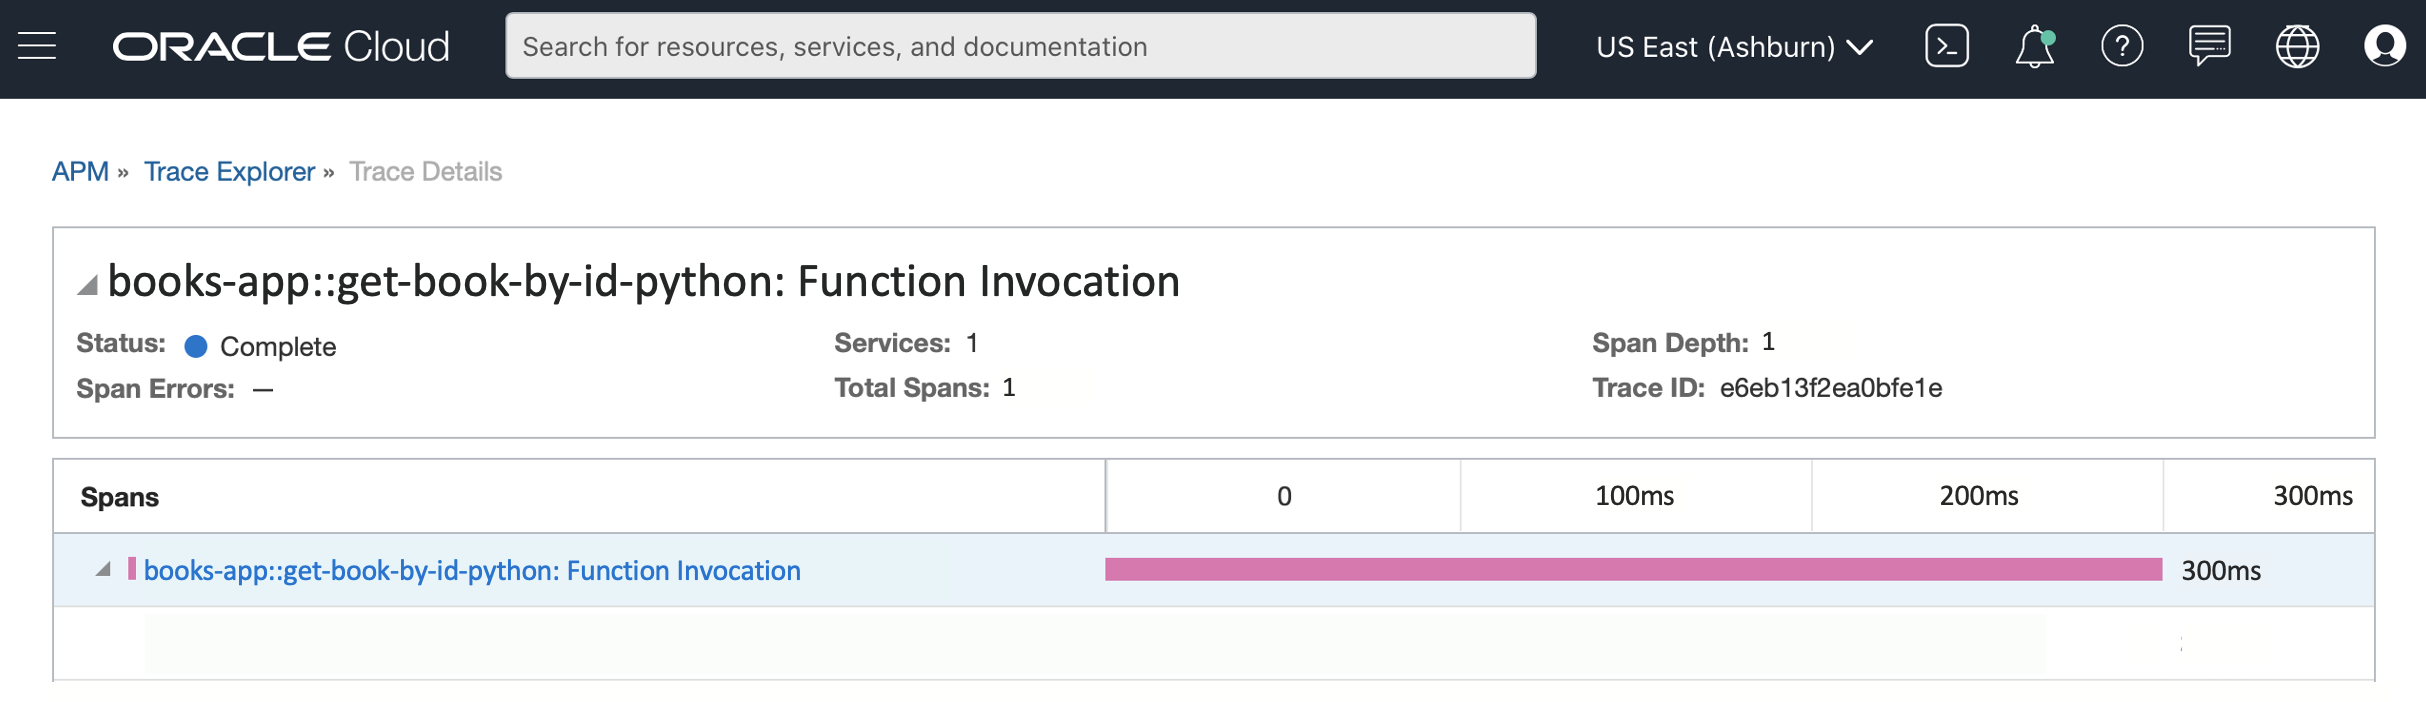
Figure 3: Default Function invocation span
You can also add instrumentation to your function code to emit custom child spans, using libraries like Zipkin to get more visibility into your code and downstream dependencies. For an example, see this Python sample. For Node.js and Java samples, see the documentation.
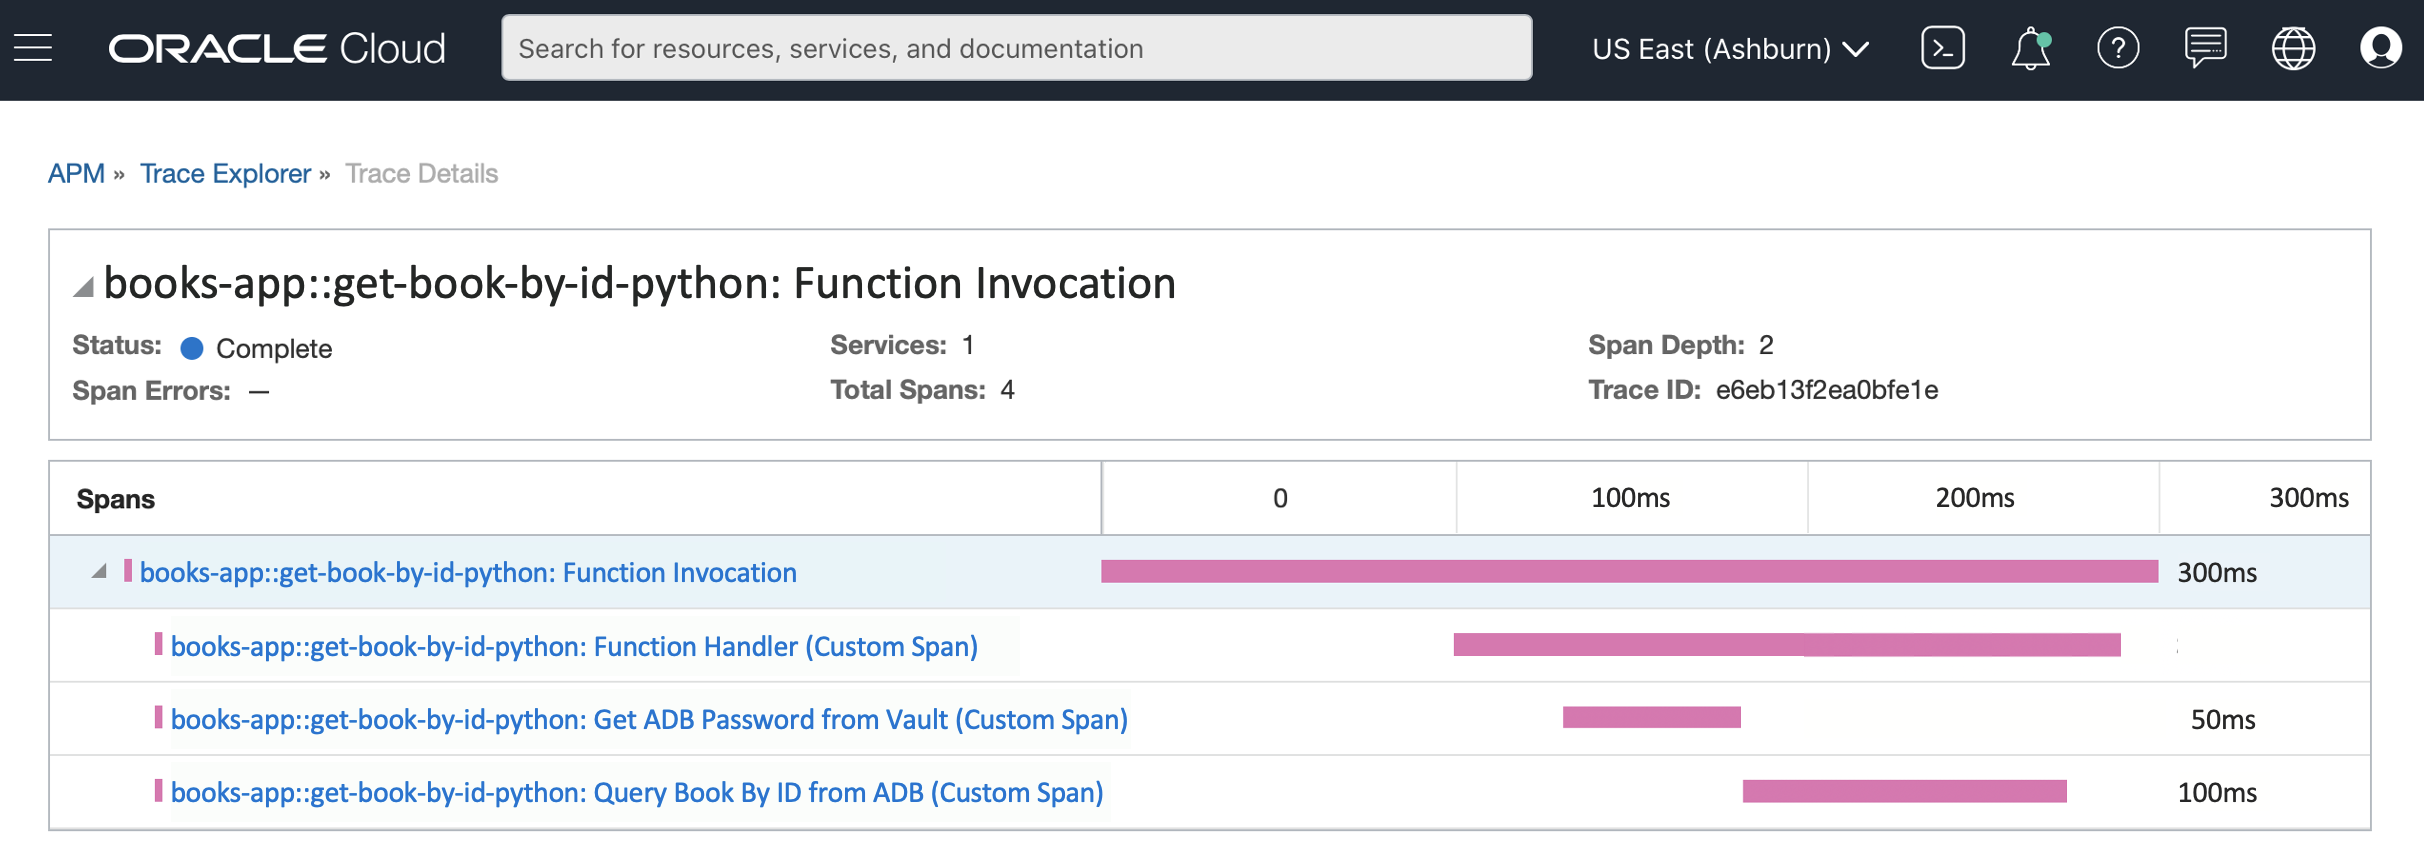
Figure 4: Custom child spans
Now you can observe your Functions-based serverless applications using traces, logs, and metrics.
Next steps
For more information, see Distributed Tracing for Functions, and Announcing the general availability of Oracle Cloud Infrastructure Application Performance Monitoring.
To get started with Oracle Functions, see the quick start guide, sample repo, and documentation. If you haven’t tried Oracle Cloud Infrastructure yet, try it for free today.