In my previous blog, I gave an overview of Oracle Cloud Infrastructure (OCI) API Gateway observability. This time I’m taking a deeper look into using OCI Logging Analytics to gain insight on OCI API Gateway logs.
This post covers setting up API Gateway logging, setting up Logging Analytics, setting up Service Connector Hub to send API Gateway logs to Logging Analytics, and creating a Dashboard. Prerequisites include a working knowledge of OCI API Gateway and OCI in general.
For the sake of simplicity, I have created all resources in the same compartment. Your security might require that different log types be stored and analyzed in different compartments, which is fully supported.
Enable API Gateway logging
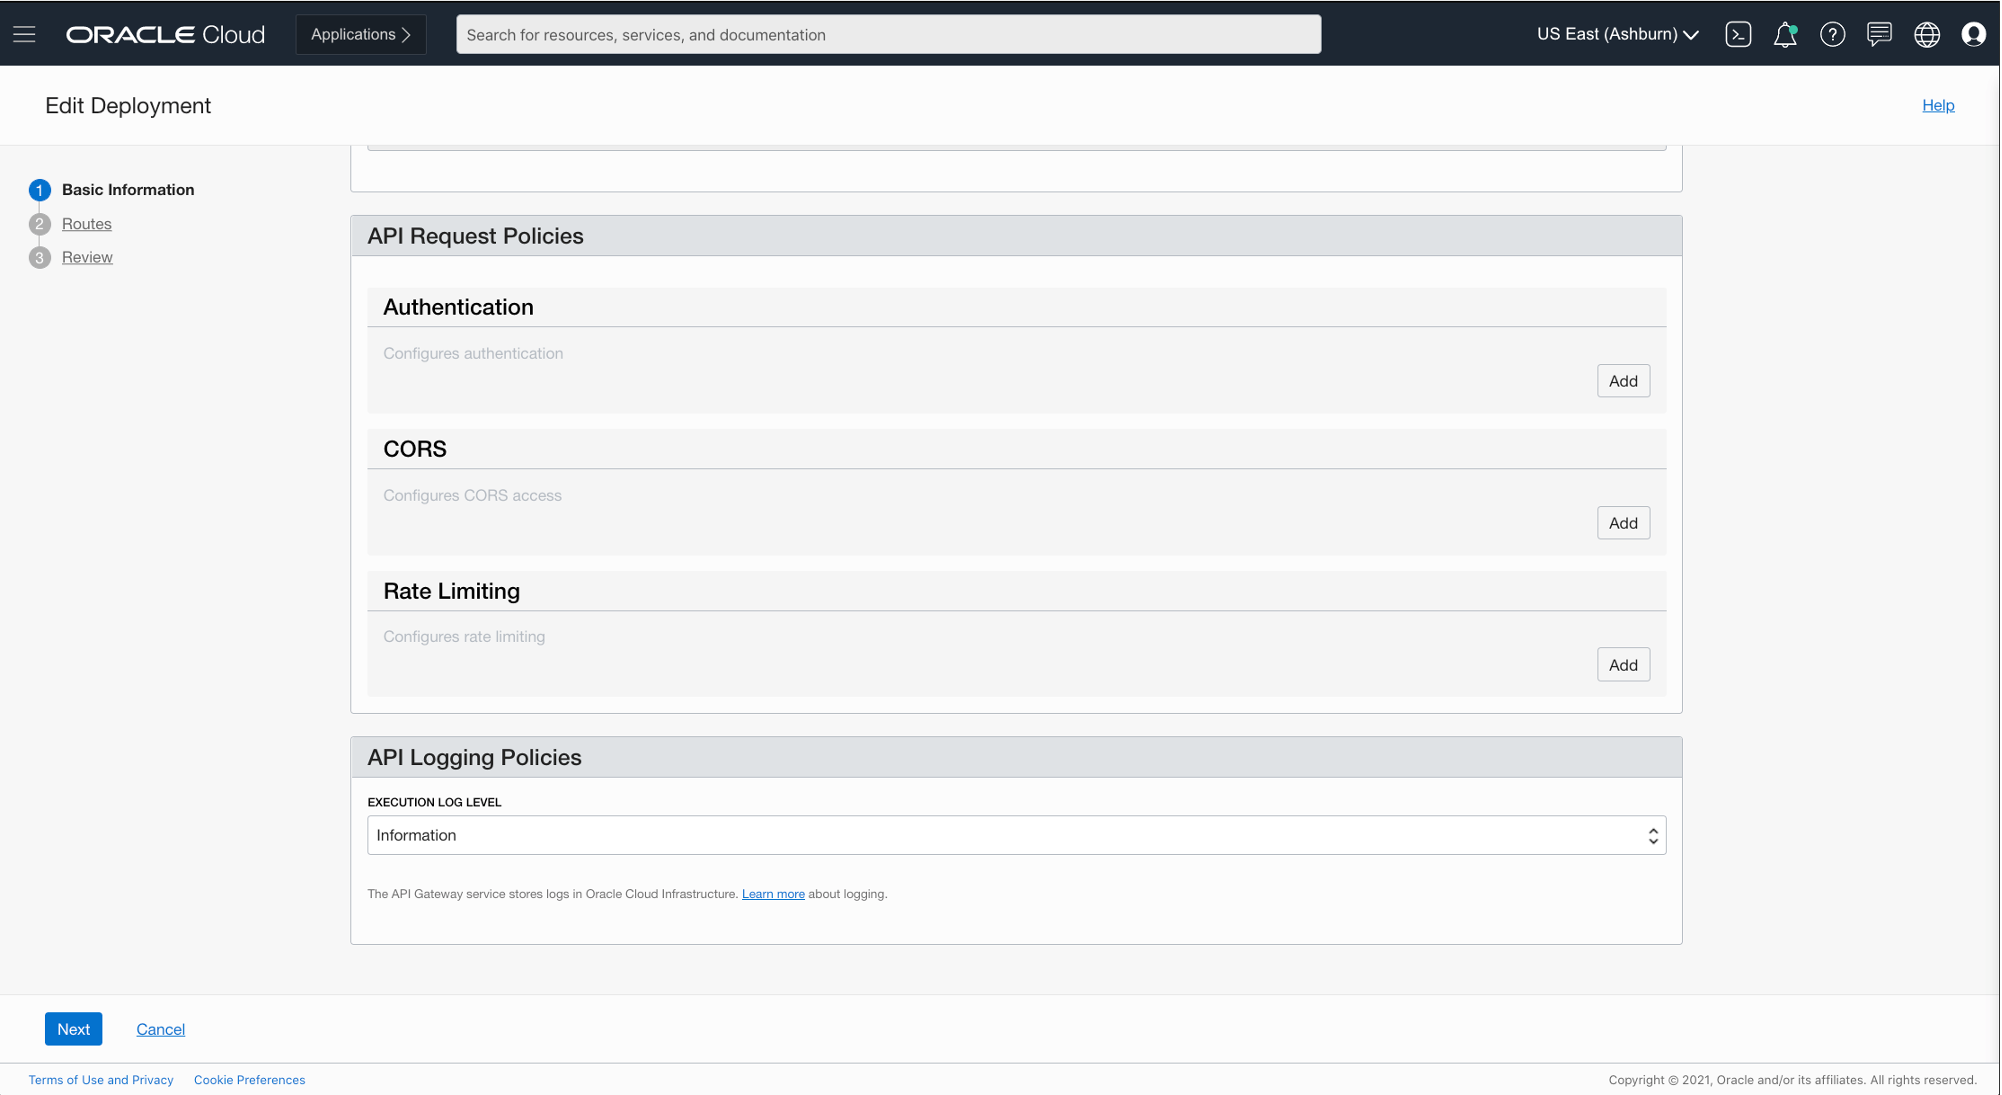
Gateway logs are controlled at the deployment level within a gateway and are disabled by default. To collect the data to build any real insights, we need to set the deployment logging level to Information and enable the logs.
Navigate to your deployment in the Console, select Edit, and set the logging policy to Information. This setting is the default, but it’s worth checking.
Next, navigate to Logs for the deployment.
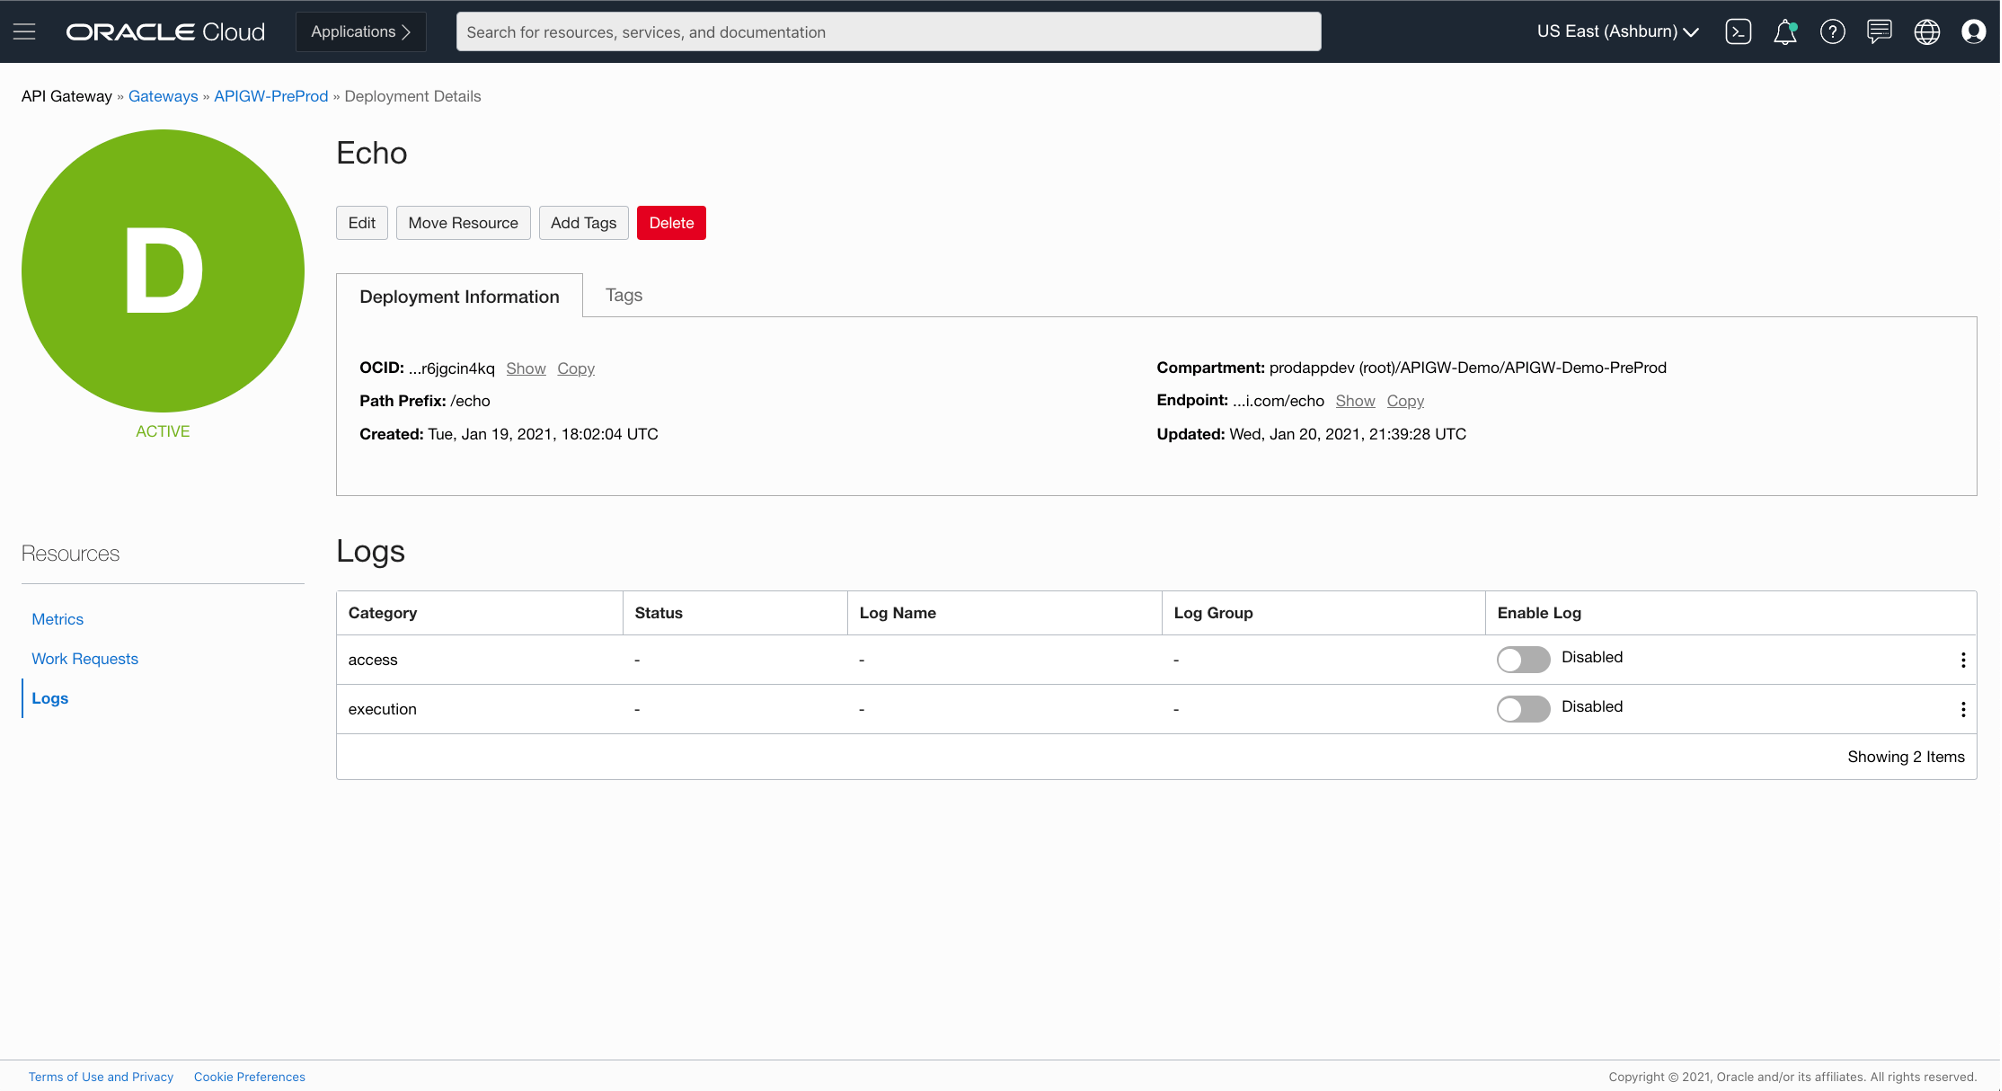
There are two log categories, access and execution. For completeness, enable both. However, if you want to limit log storage requirements, enable only the access log.
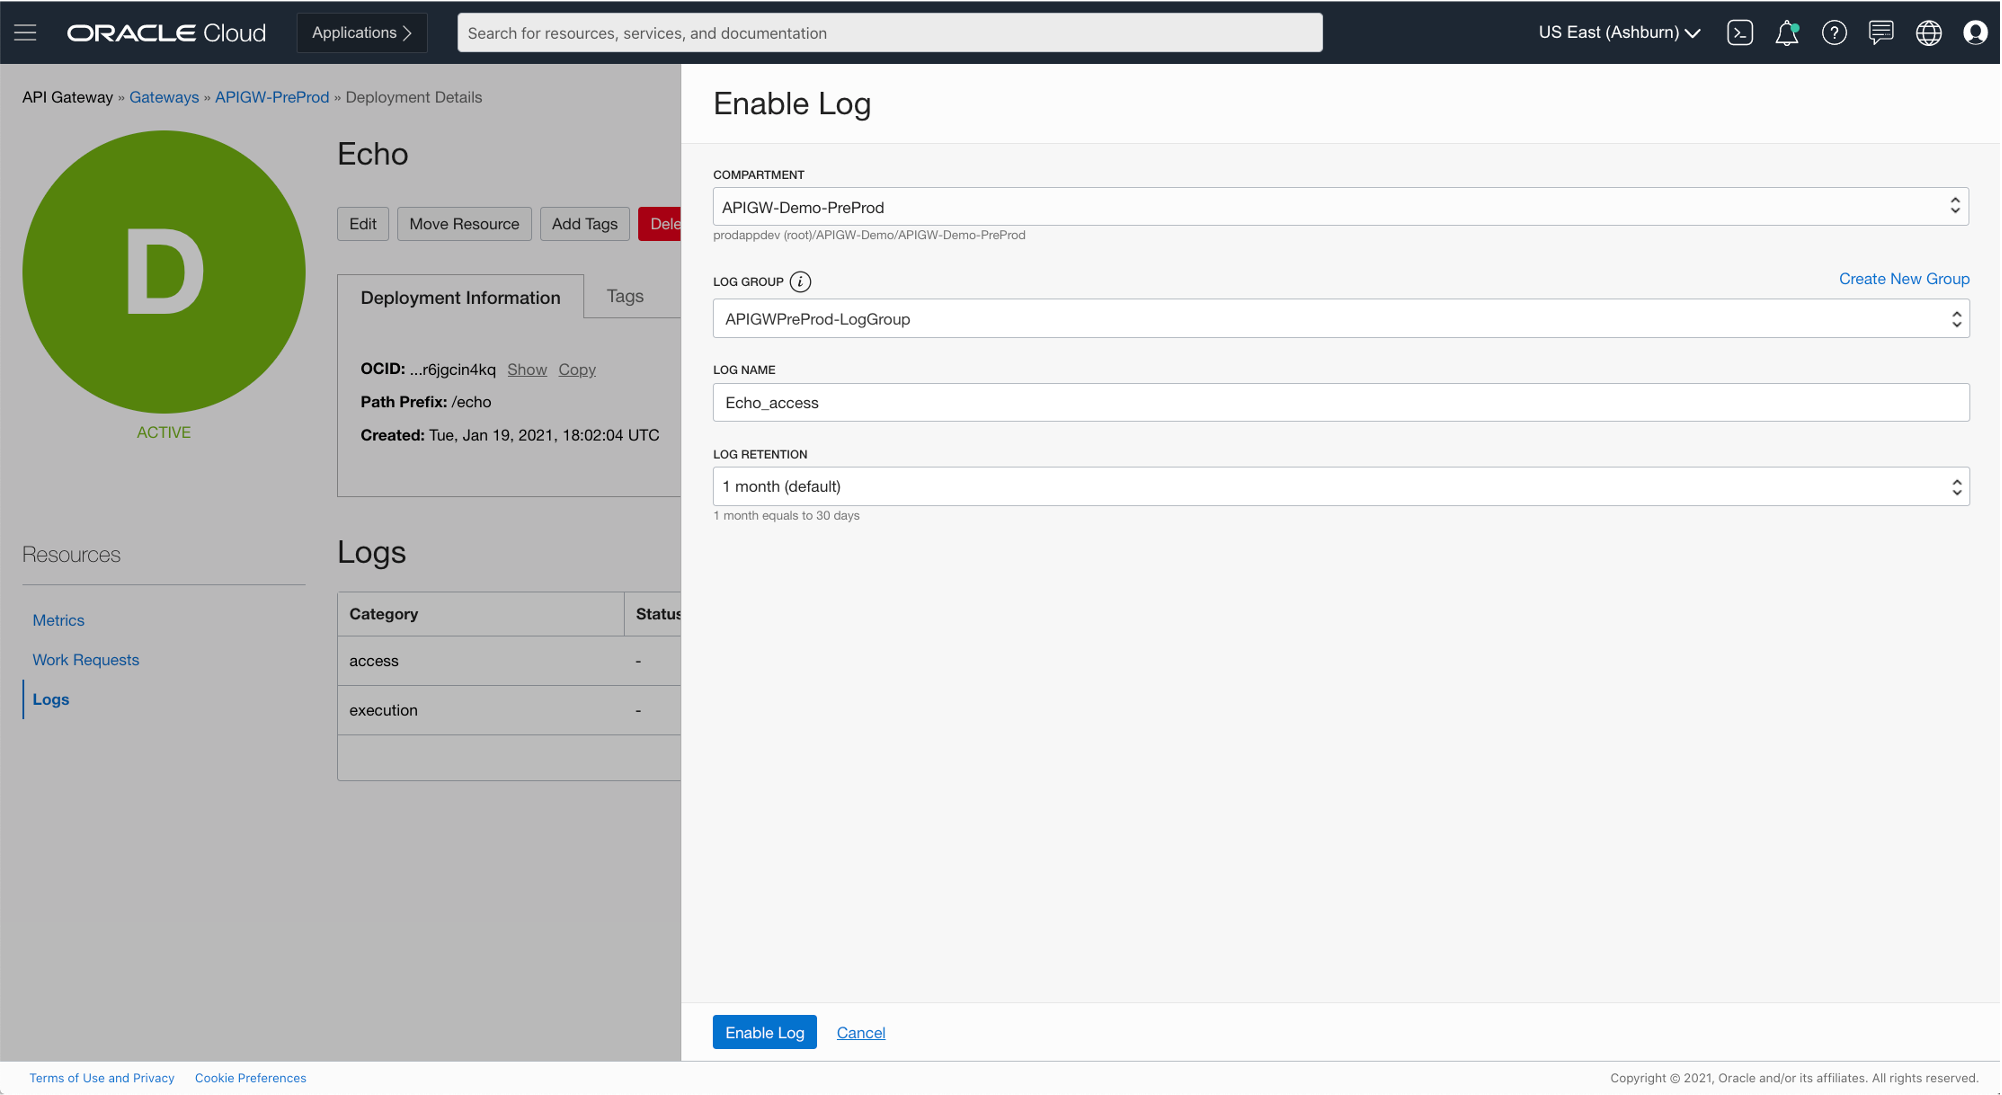
After completion, click Log Group to see the API Gateway log records.
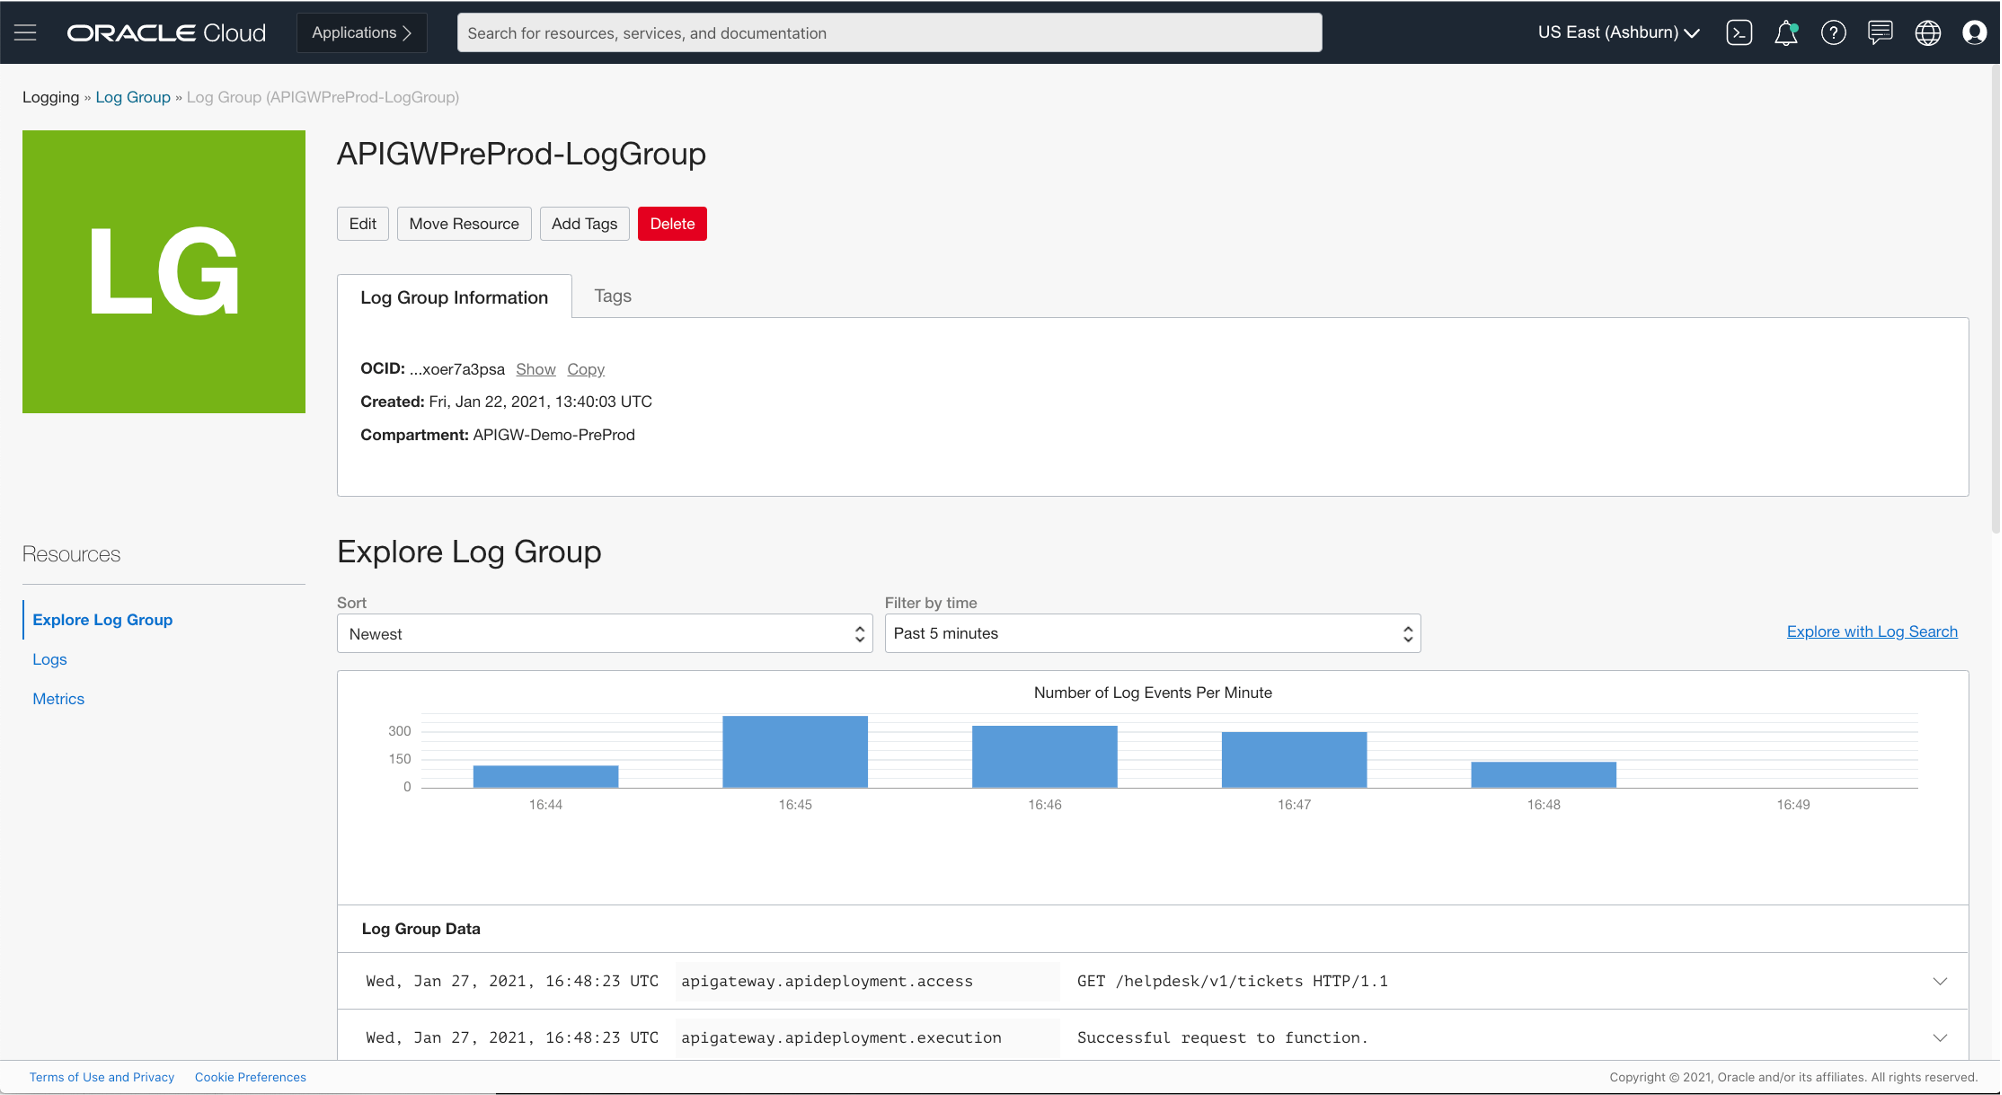
API Gateway logging is now active, and you can search the logs by clicking Explore with Log Search.
Set up Logging Analytics
To use Logging Analytics, you need to set up some security policies to allow the service correct access to resources in your tenancy.
The easiest way is to follow the first two sections of the quick start guide. These instructions get the policies set up and Logging Analytics enabled in your tenancy for the region you’re working in. We don’t need to install a management agent because we have logging in the API Gateway deployment enabled. The rest of the quick start guide is useful for learning about different ways to explore logs. If you need more detailed information, see the service documentation.
Next, we need to set up a log group within Logging Analytics as a target for the API Gateway logs.
Navigate to Logging Analytics and then click Administration. Select Log Groups.
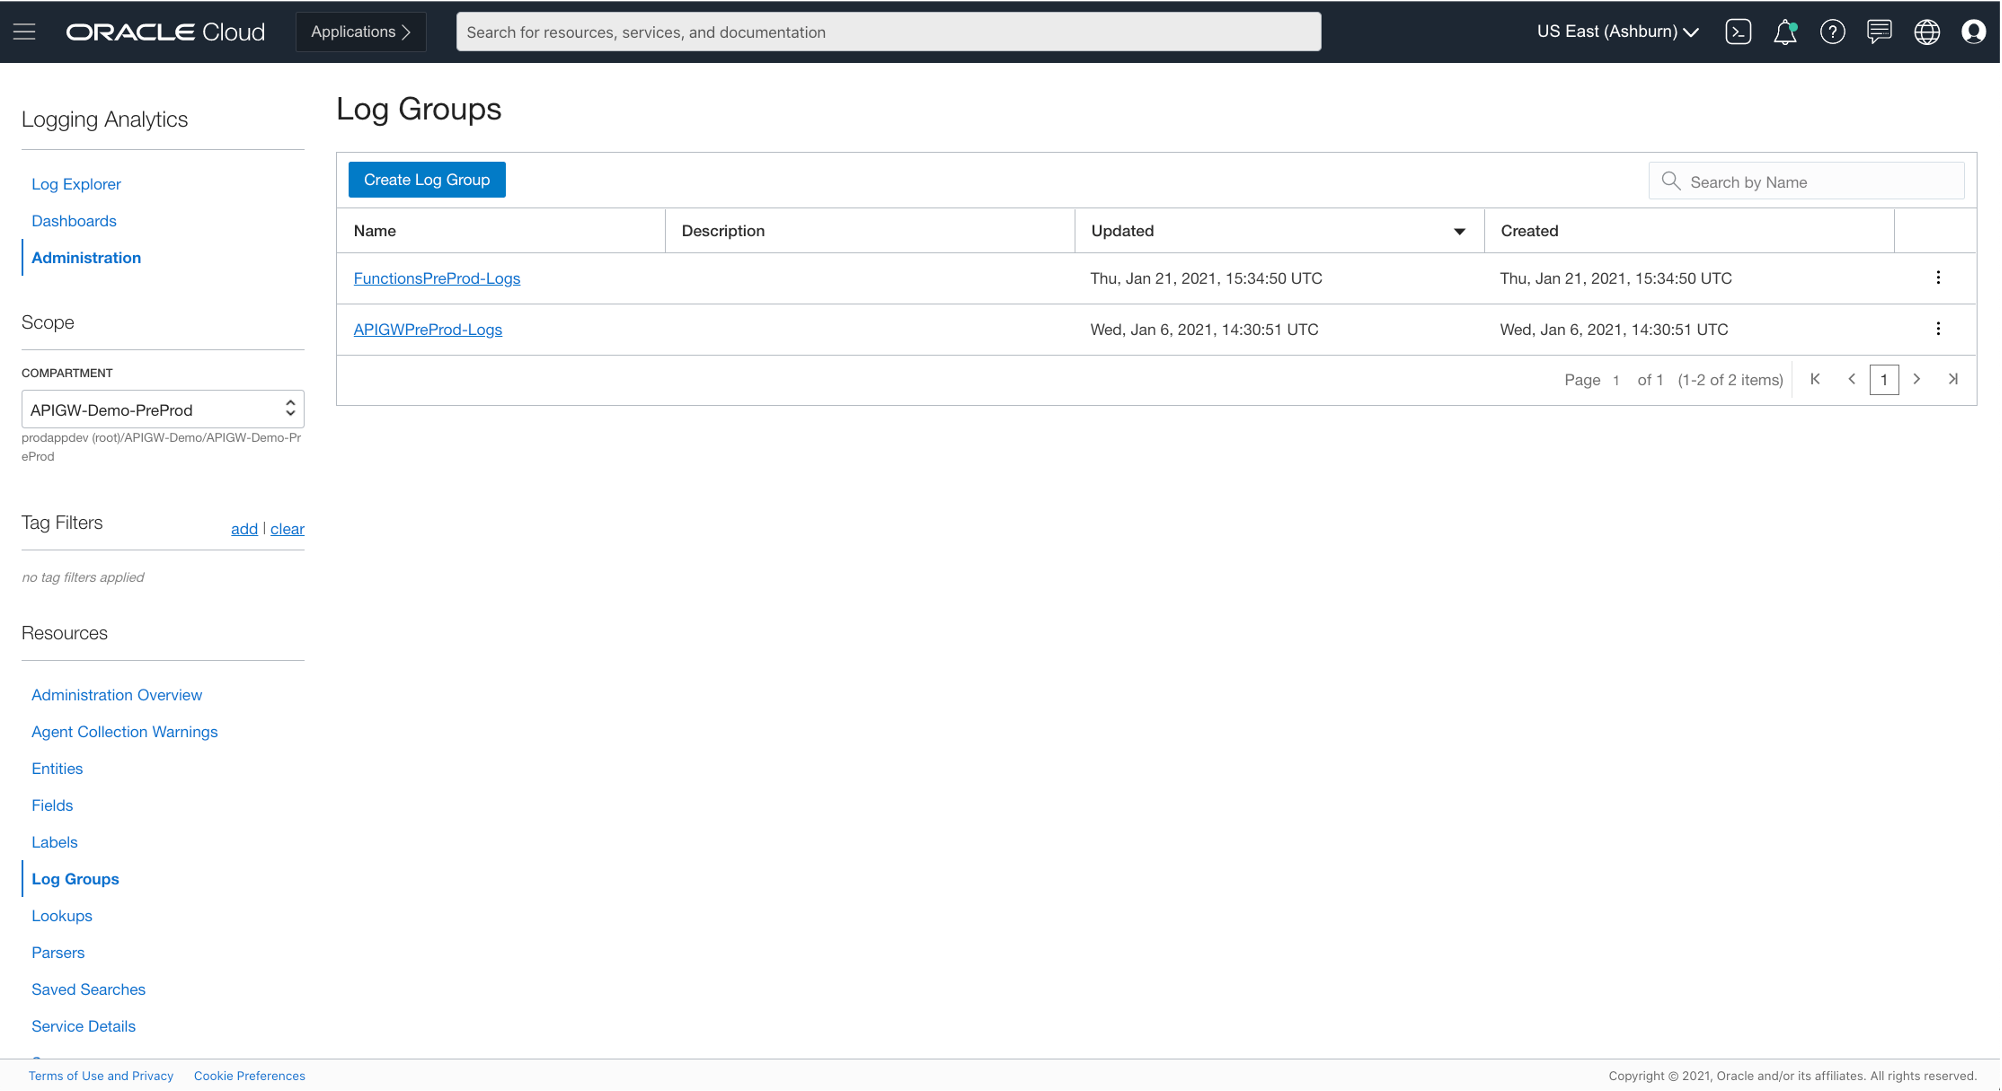
Click Create Log Group. Enter a name and click Create.
Send API Gateway logs to Logging Analytics using Service Connector Hub
Service Connector Hub is a cloud message bus platform that offers a single pane of glass for describing, running, and monitoring the movement of data between services in Oracle Cloud Infrastructure.
We can easily create a connector to send API Gateway log data from the log group that we created when we enabled API Gateway logging to the log group we created when we set up Logging Analytics.
Navigate to Service Connector Hub.

Click Create Service Connector.

Enter a name and description.
Select Logging as the source and Logging Analytics as the target.
To configure the source connection, select the API Gateway log group and select the run log. Click +Another Log, select the same log group, and select the access log.
To configure the target connection, select the Logging Analytics log group that we created earlier.
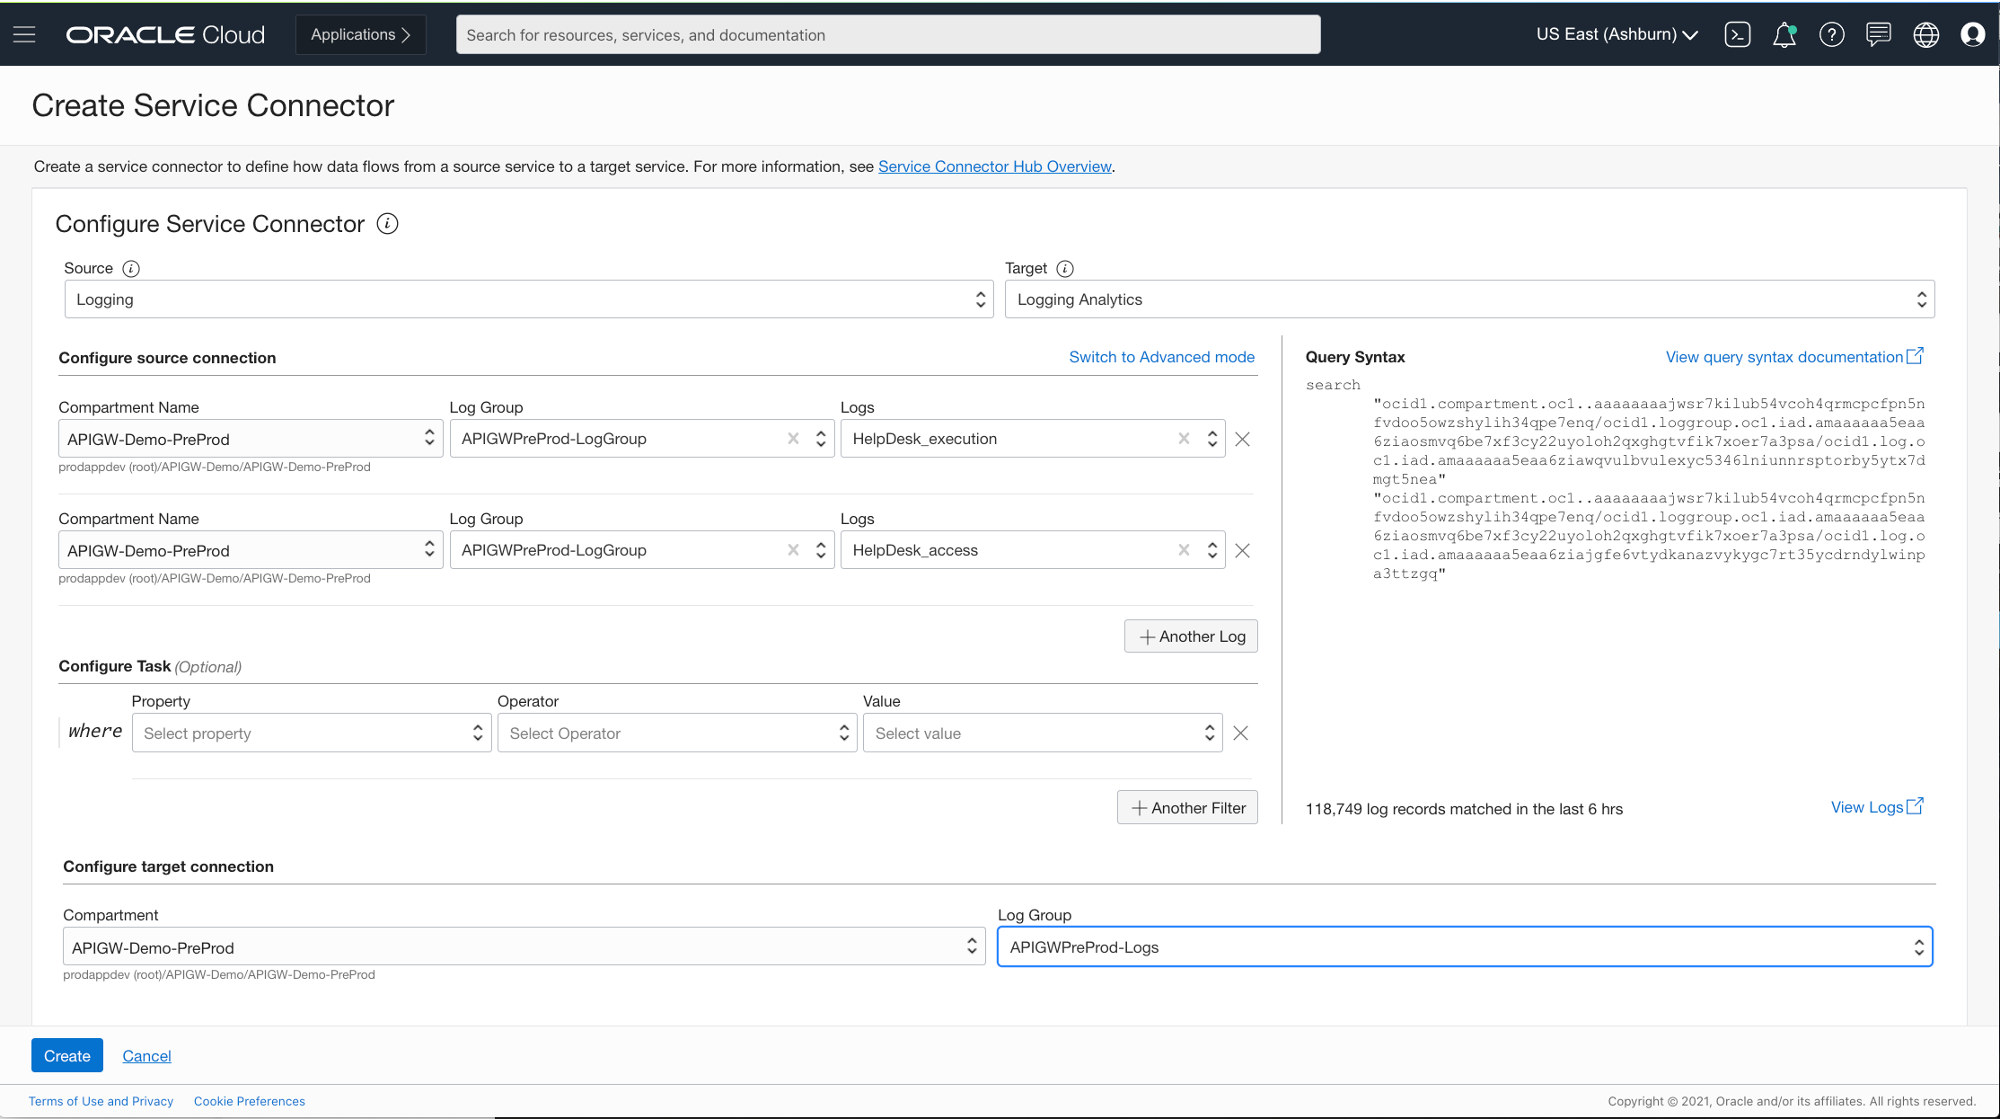
Click Create. Check that logs are sent by selecting the Service Connector and clicking Metrics. Data shows up when data is being sent.

This process can take a couple of minutes, depending on the amount of traffic going through the gateway.
Now that we have log data generated by the gateway and being sent to Logging Analytics with Service Connector Hub, we can explore the log data.
Using Logging Analytics to create a dashboard
The last stage is to create a saved log search and add this to a dashboard.
Navigate to Logging Analytics and select Log Explorer. A default search like the following example appears.

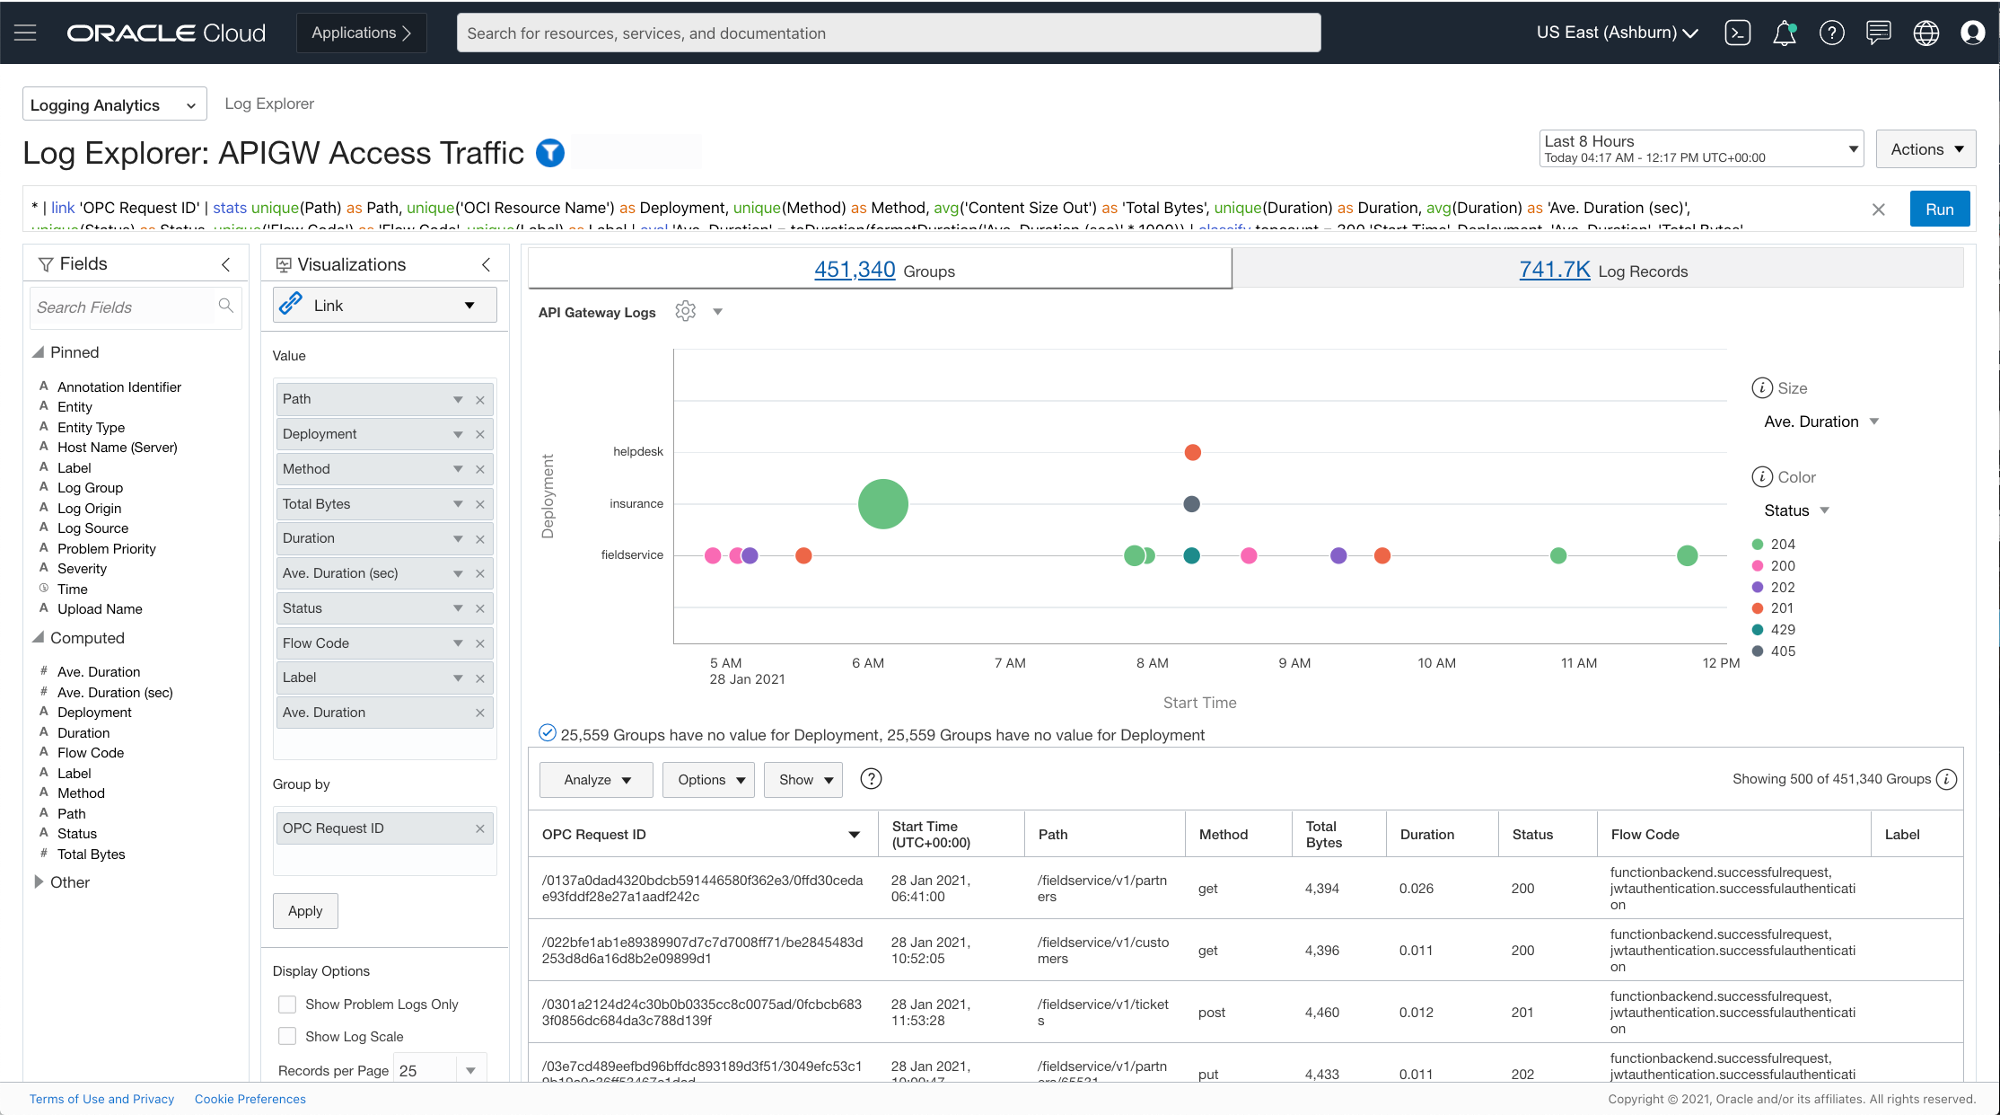
To get more insights into the gateway traffic, change the visualization and the search. Click the pie chart under Visualizations on the left panel and then select the Link icon.
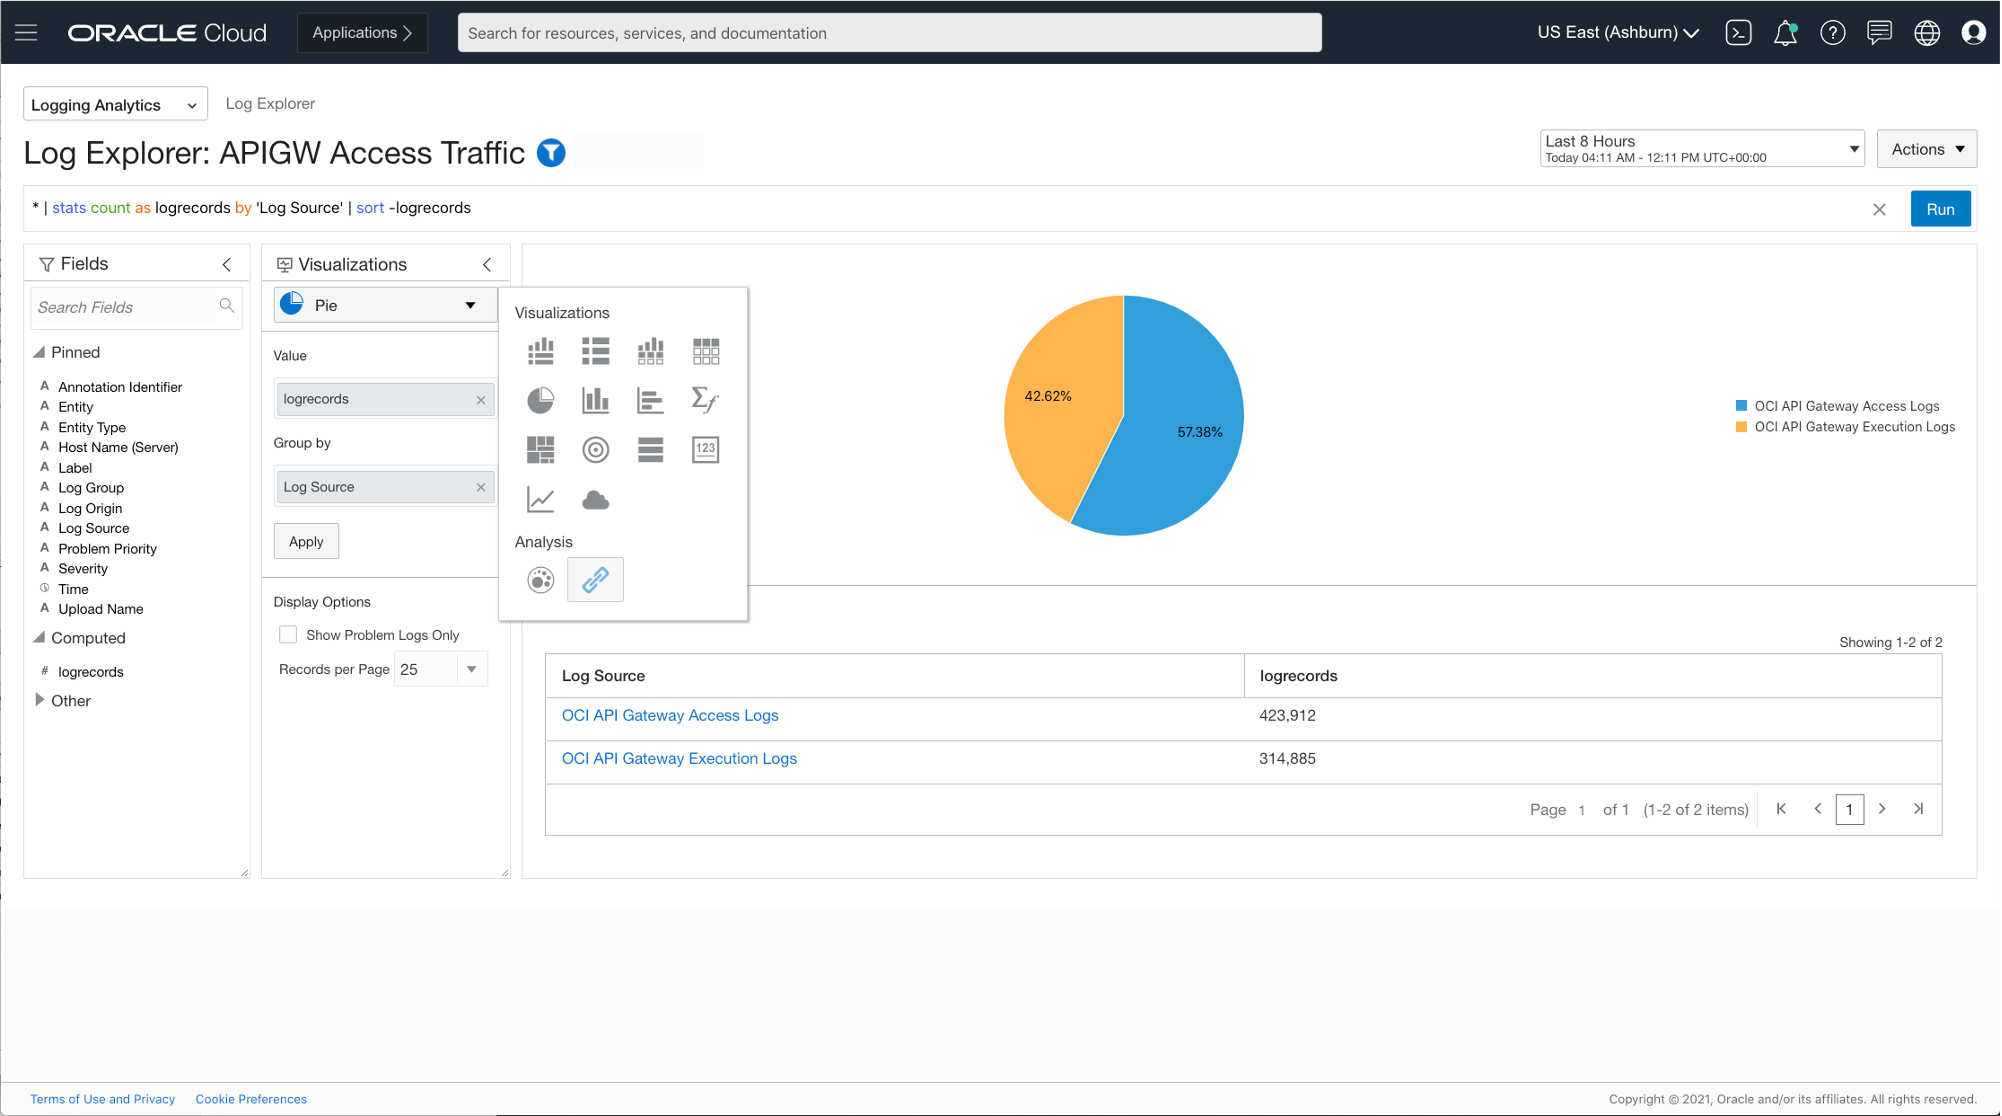
This selection changes the appearance to something not useful, so we need to change the search command.

Copy the following search statement into the search command line:
* | link ‘OPC Request ID’ | stats unique(Path) as Path, unique(‘OCI Resource Name’) as Deployment, unique(Method) as Method, avg(‘Content Size Out’) as ‘Total Bytes’, unique(Duration) as Duration, avg(Duration) as ‘Ave. Duration (sec)’, unique(Status) as Status, unique(‘Flow Code’) as ‘Flow Code’, unique(Label) as Label | eval ‘Ave. Duration’ = toDuration(formatDuration(‘Ave. Duration (sec)’ * 1000)) | classify topcount = 300 ‘Start Time’, Deployment, ‘Ave. Duration’, ‘Total Bytes’, Status, Label as ‘API Gateway Logs’
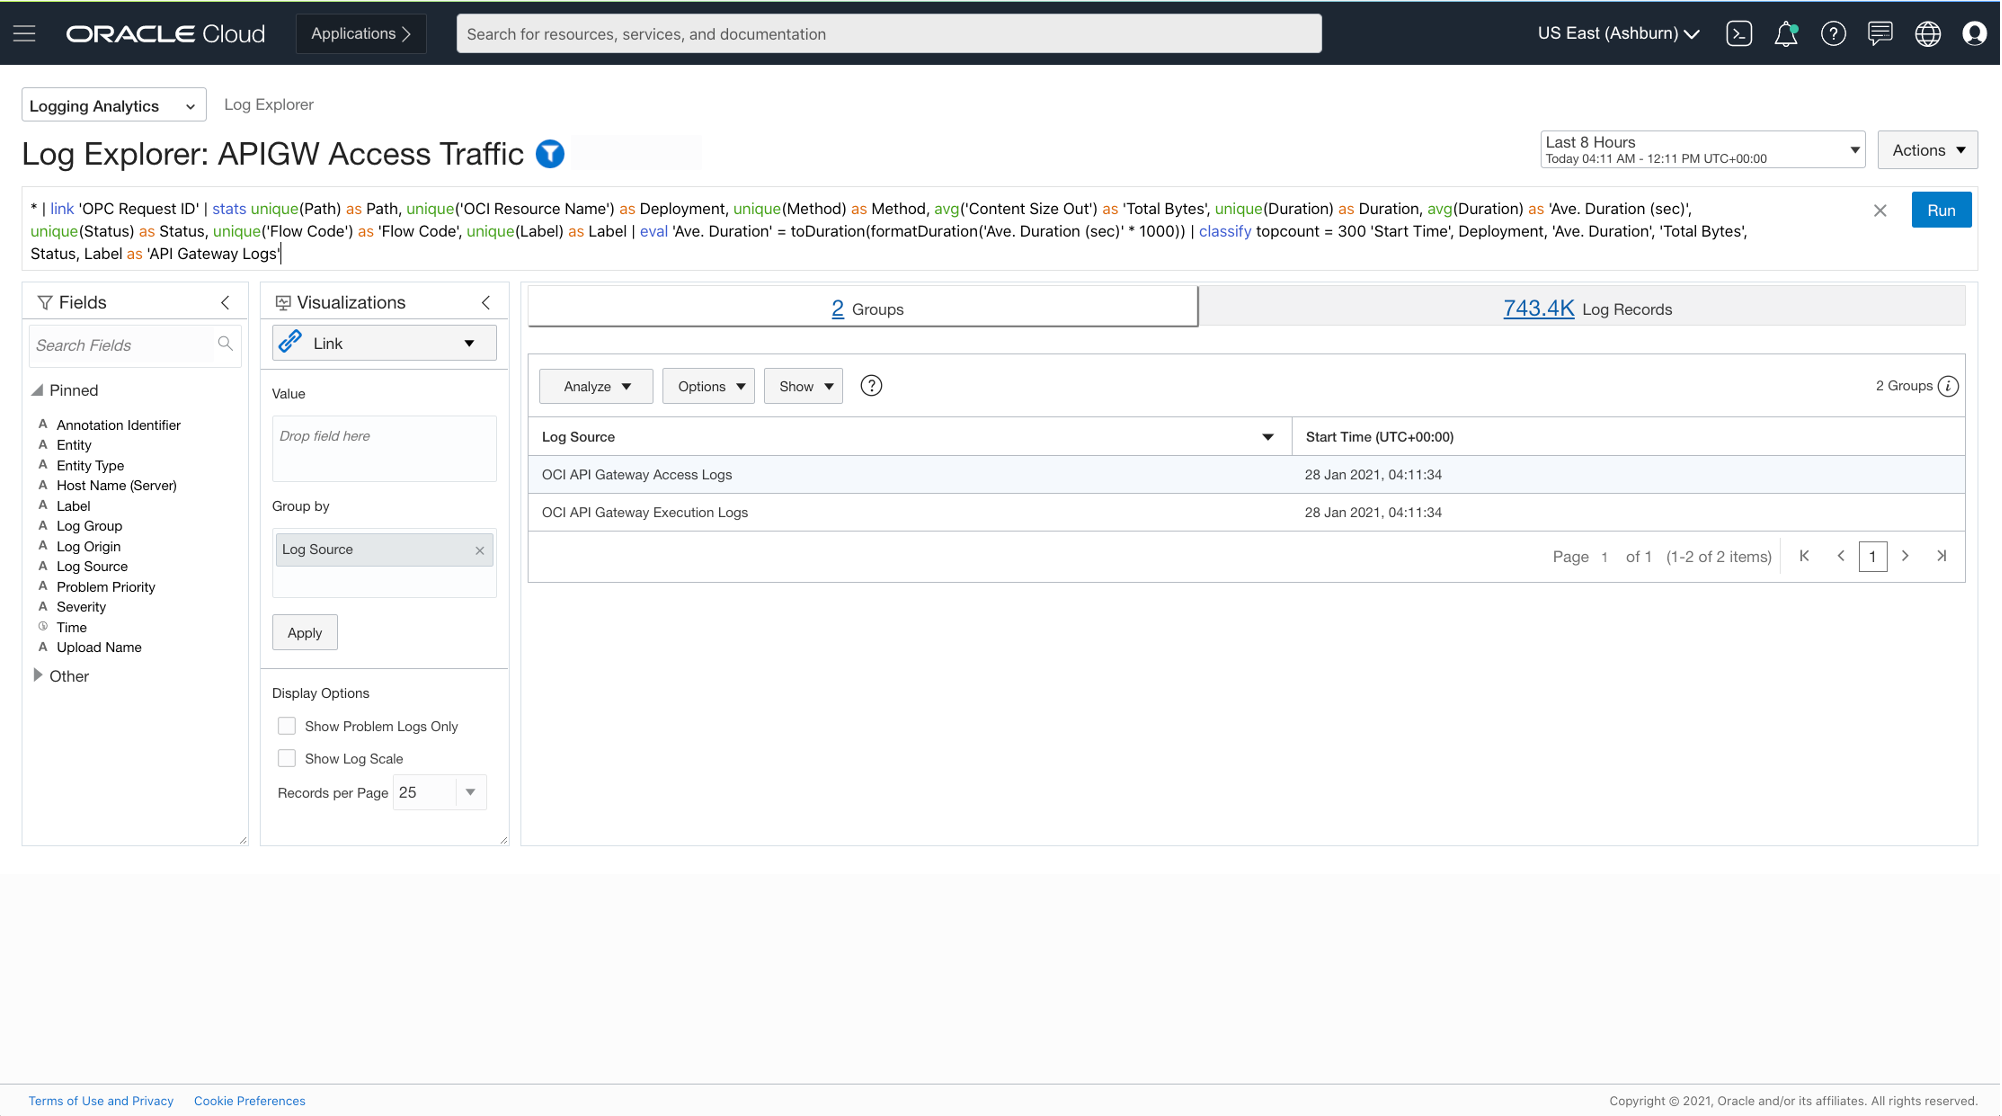
Click Run.
You get a visualization of status code distribution over time with the average API Call duration and a list of log record details. You can change the visualization filters to see different views.
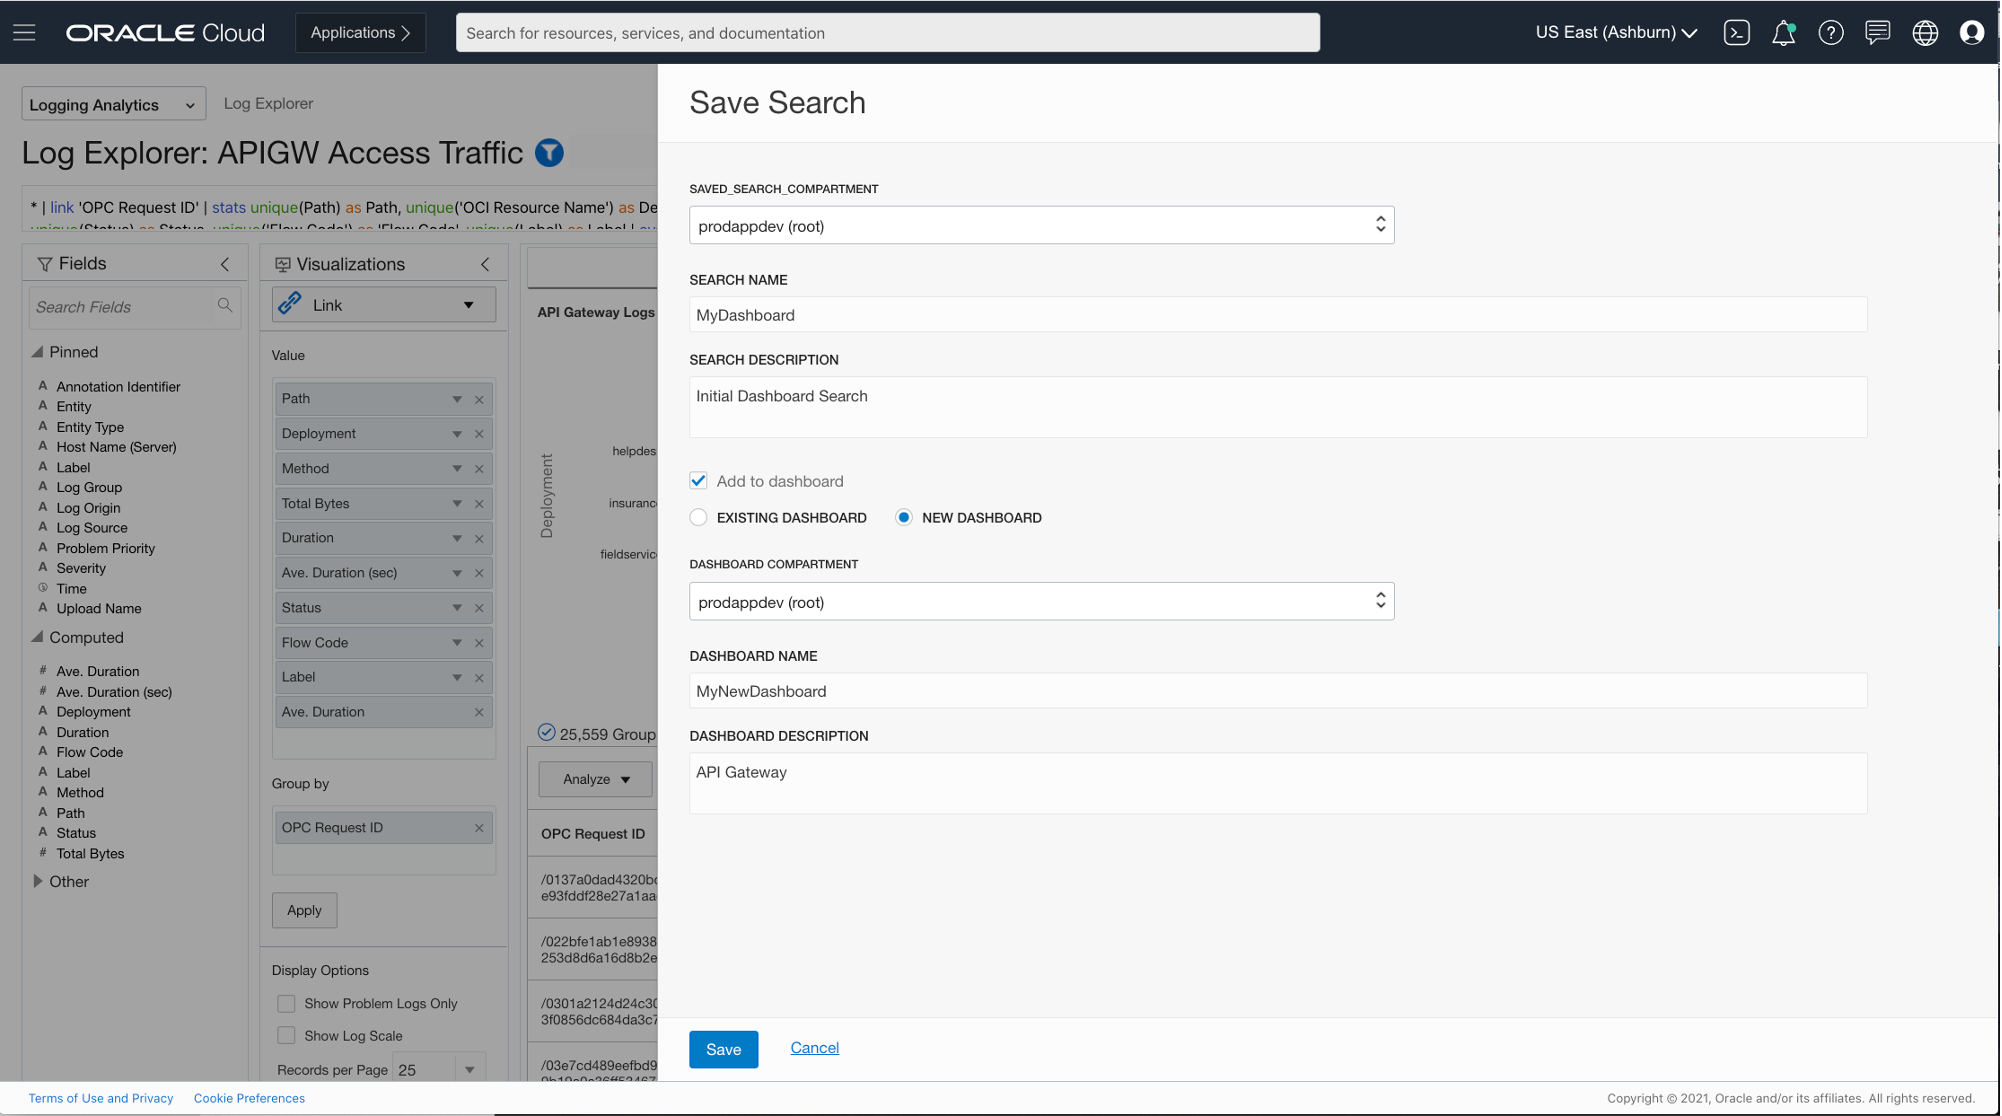
In the top right of the screen, click Actions. Select Save As, enter a name for the search, select Add to Dashboard, select NEW DASHBOARD, and enter a name and description.
Now navigate to Logging Analytics and Dashboards. Select the dashboard you created, which looks like the following screenshot.
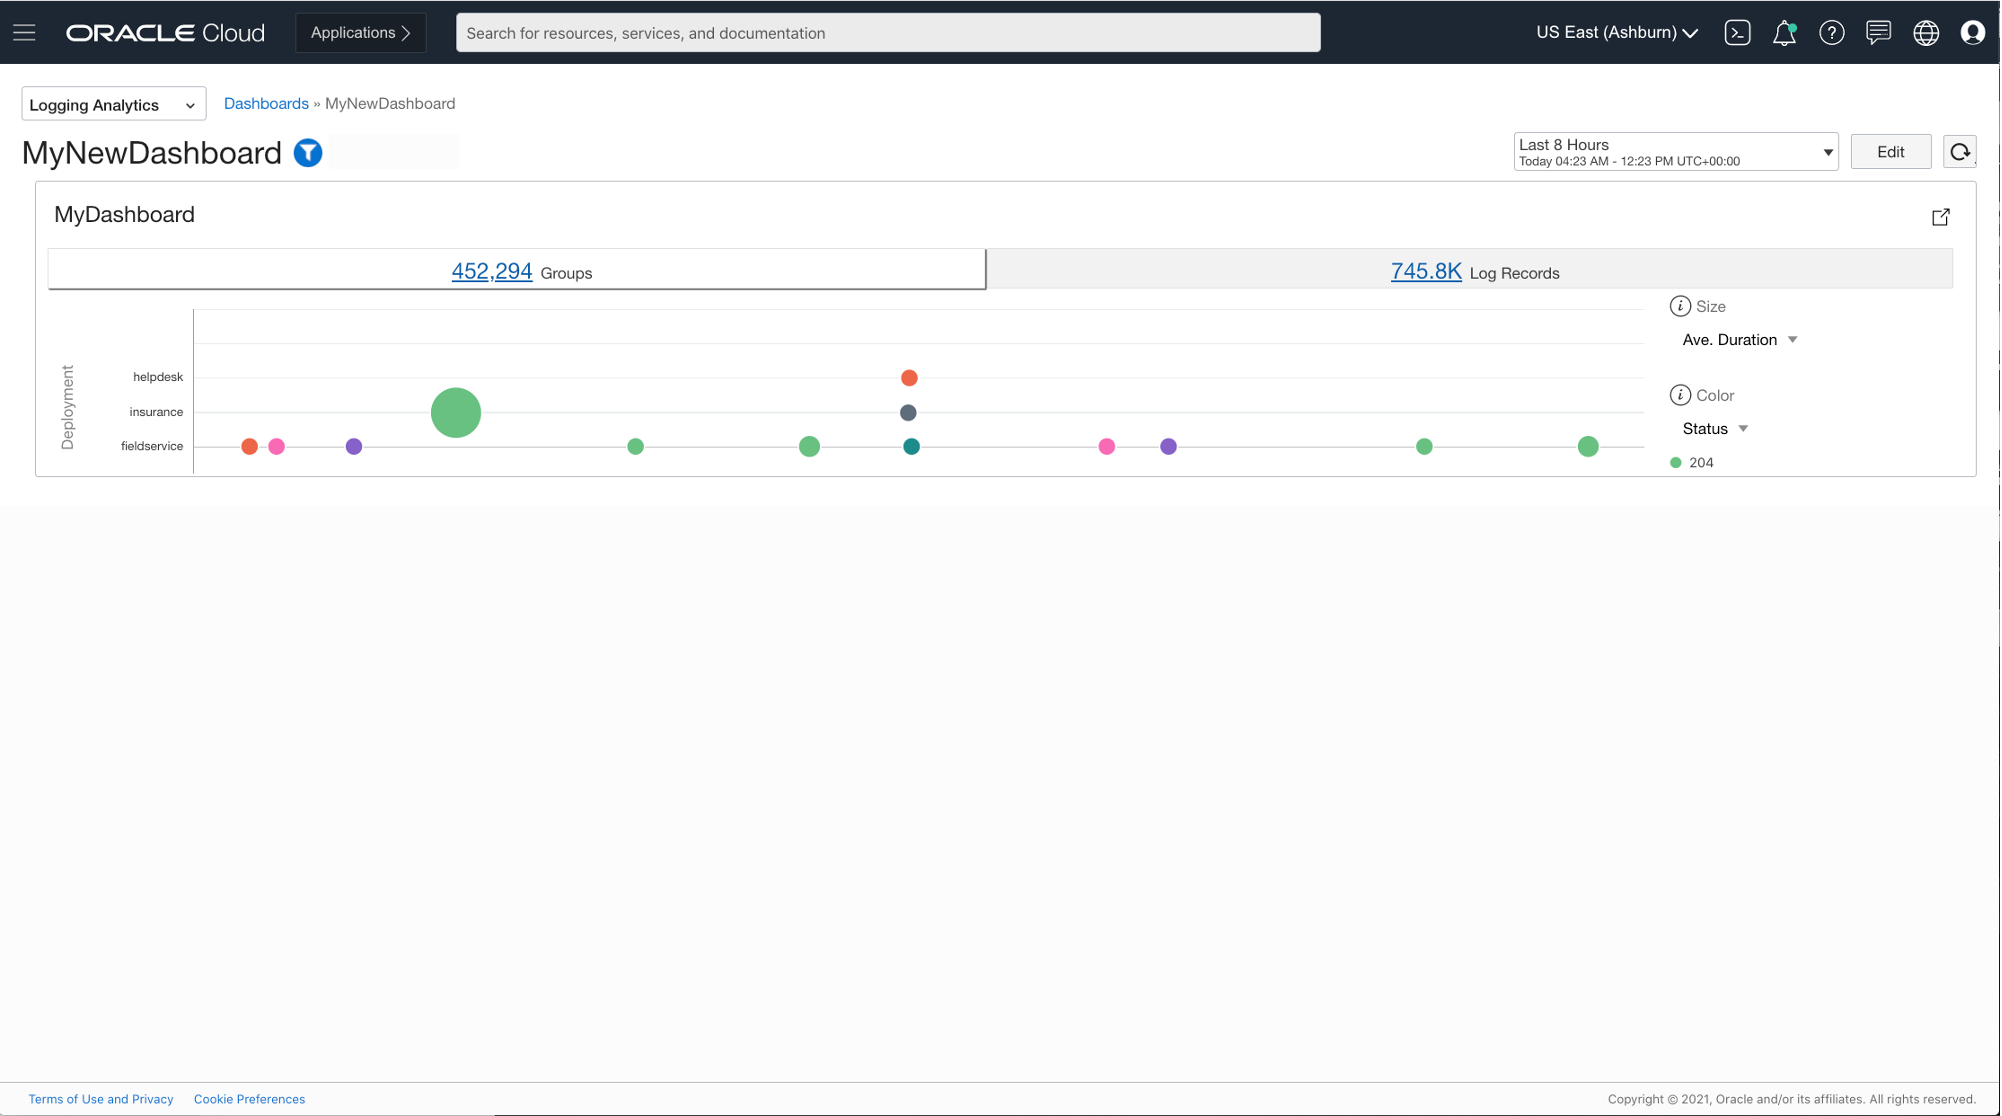
Because we created a dashboard as a shortcut when saving the search, it created a default sized widget that doesn’t display enough of the information. So, we need to resize it.
To go into edit mode, click Edit.
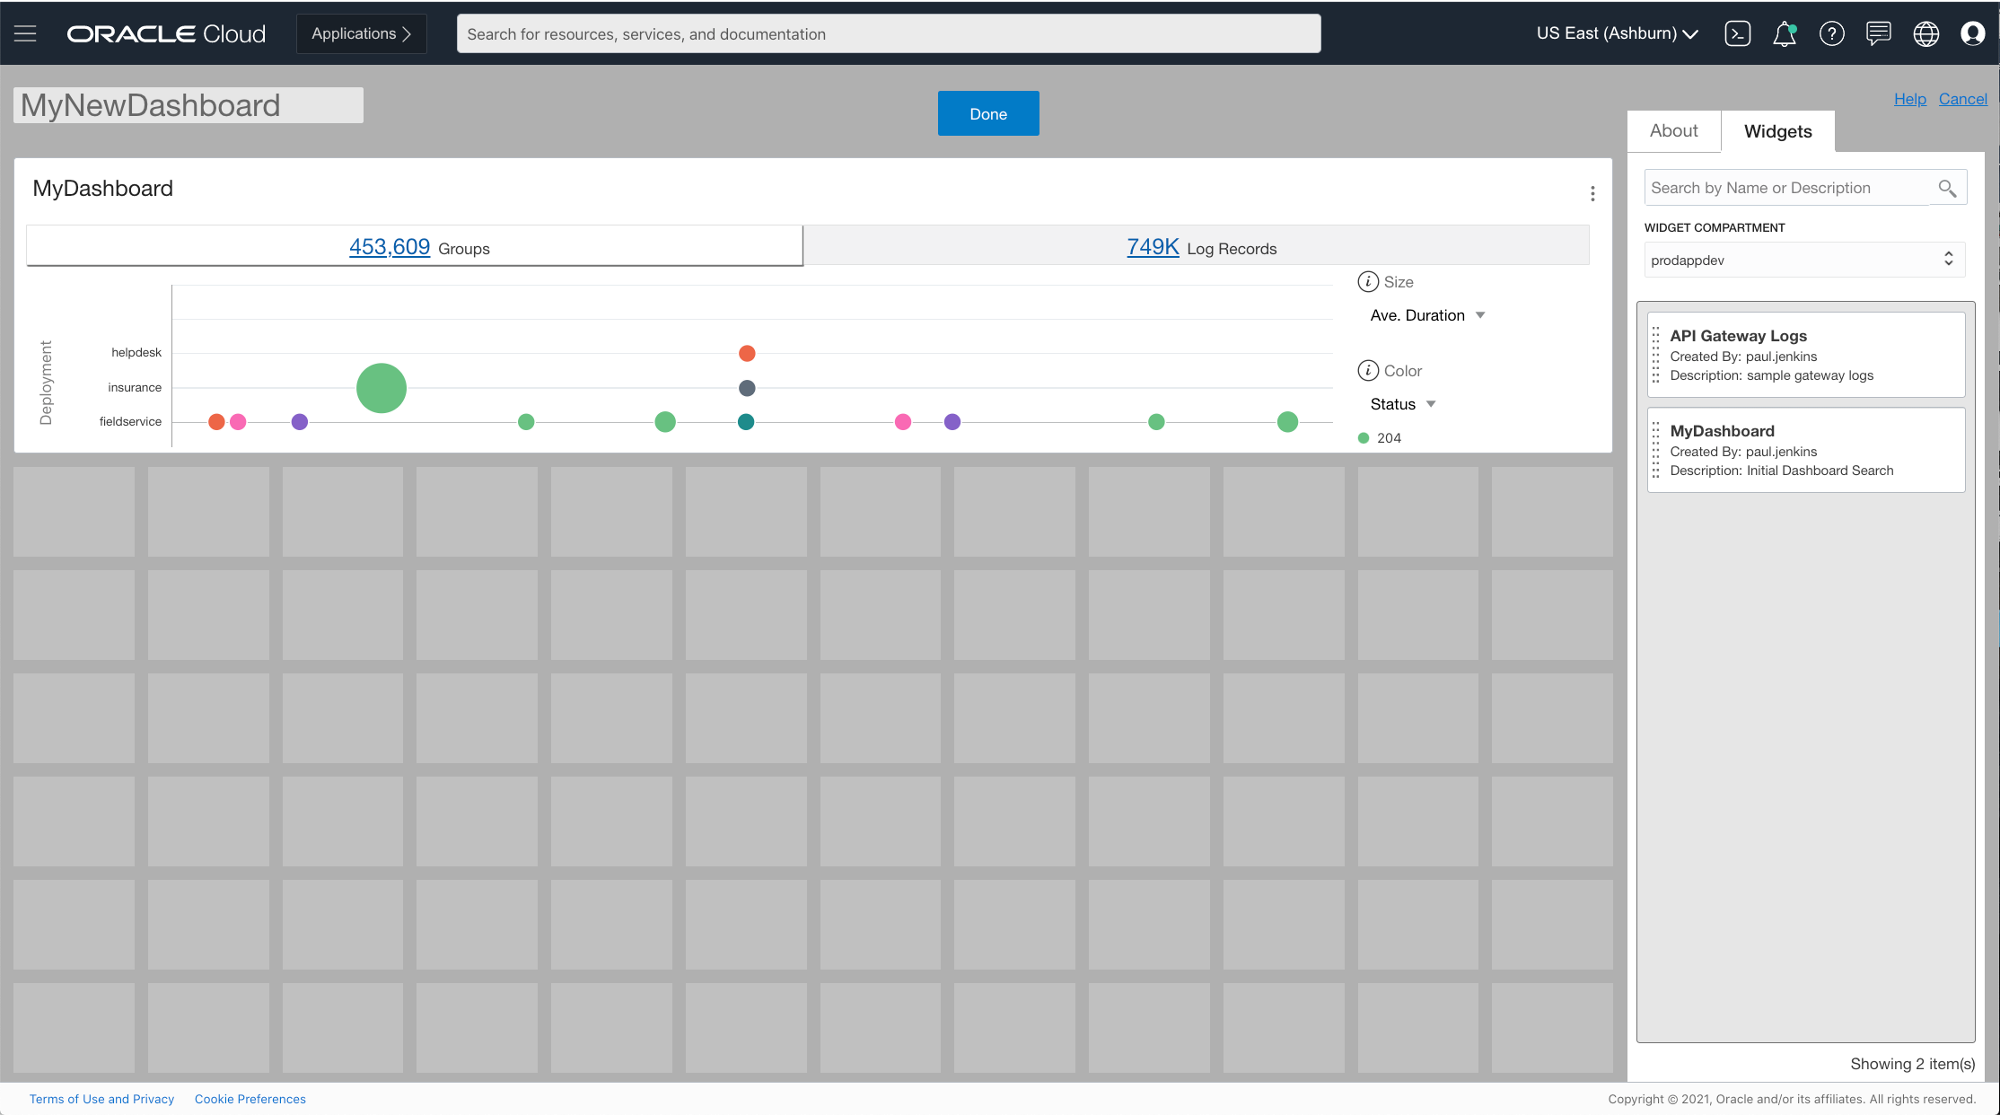
Hover over the bottom edge of the widget and resize it to fill the dashboard.

Click Done, and the dashboard now displays a full screen of information.
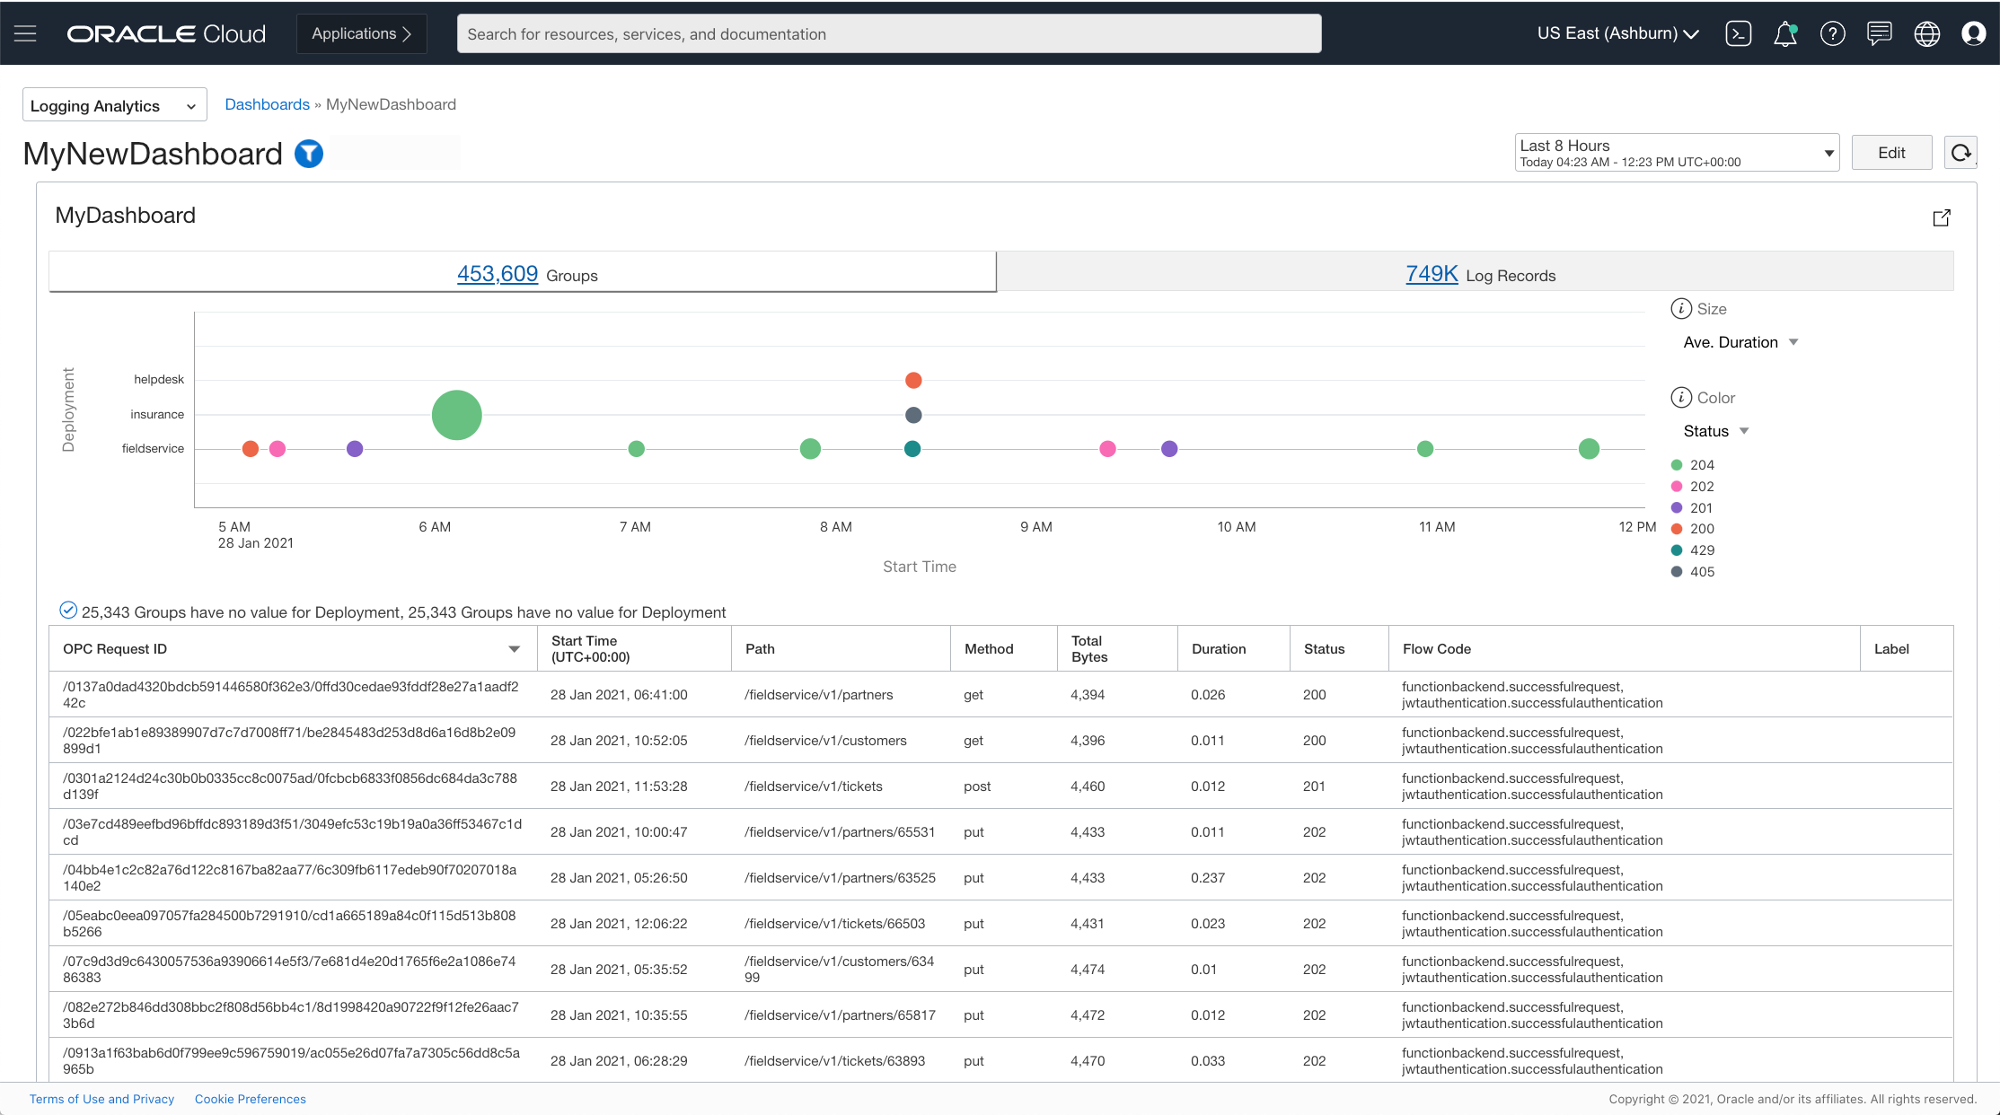
You now have a Logging Analytics dashboard for API Gateway log analysis.
Next steps
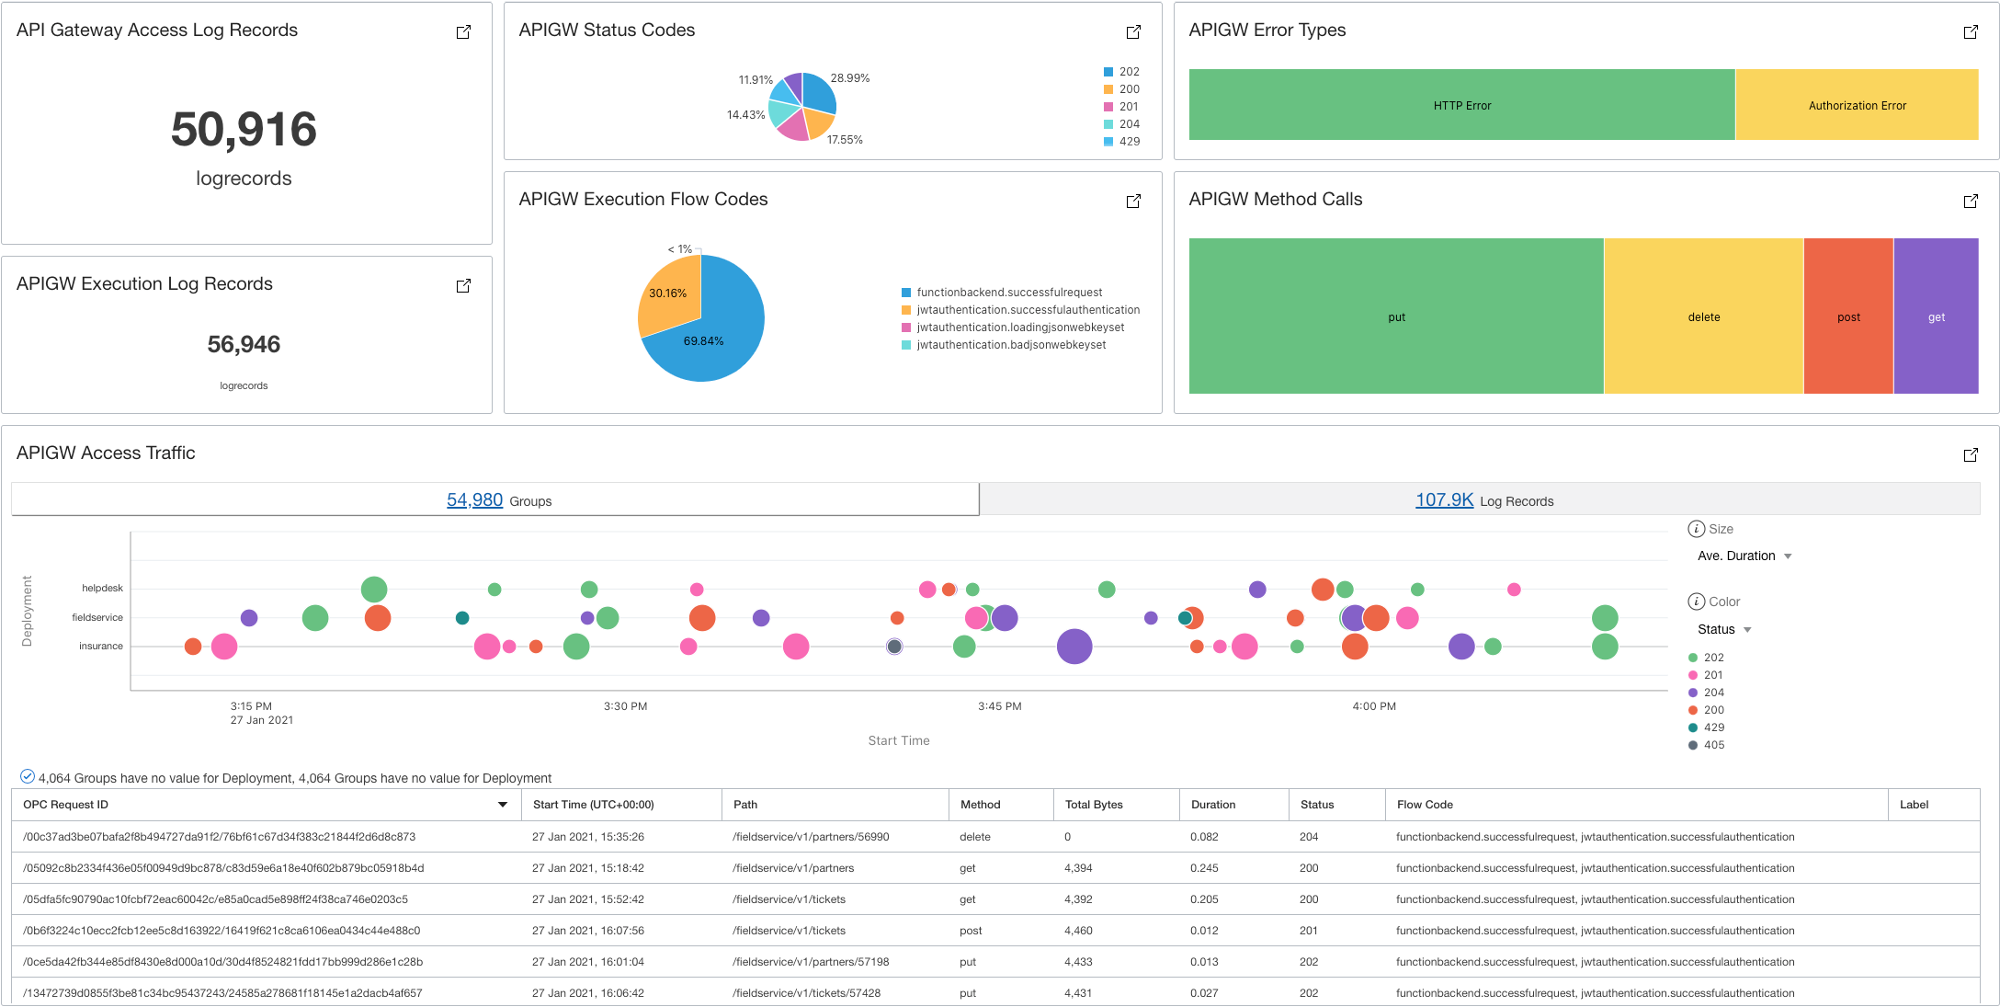
You can create other saved searches and add them to the dashboard. You can save and add them in edit mode by dragging them from the widget list on the right side and arranging them on the canvas.
The following screenshot is an example of visualizations that you can bring together in a dashboard that can be useful for API Gateway managers.
For an overview of the service, see the OCI Logging Analytics launch announcement.
For more ideas for dashboards using Logging Analytics for other services, see the following blog posts:
