Introduction
Data analysis plays a crucial role in Formula 1 racing, with teams utilizing a number of sensors strategically placed on different car components to generate an extensive amount of data. This data can inform future improvements related to engineering, driving, and race strategy. While I don’t have access to this sensor data, I do have access to historical race information that spans between 1950 and 2021. I identified a dataset where each record reflects how a driver performed in a specific Formula 1 race. To simplify the data for the blog, I filtered the dataset to include only first, second, and third place finishers for each race. My goal was to present this race information clearly by creating a column that lists the drivers grouped by race, separated by commas, and in the order in which they finished. I accomplished this using a tool offered in data flows in Oracle Analytics Cloud (OAC) called list aggregation. List aggregate is a powerful function that enables users to restructure their data by consolidating information about related entities into a new organized column. Let’s say, for example, you have a dataset where each row represents an item you purchased at the grocery store with multiple rows per shopping trip. List aggregation allows you to view this data per shopping trip with a new column containing a list of items purchased on that trip. Let’s examine how I leveraged the list aggregate function in the Formula 1 use case.
Data Flow Steps
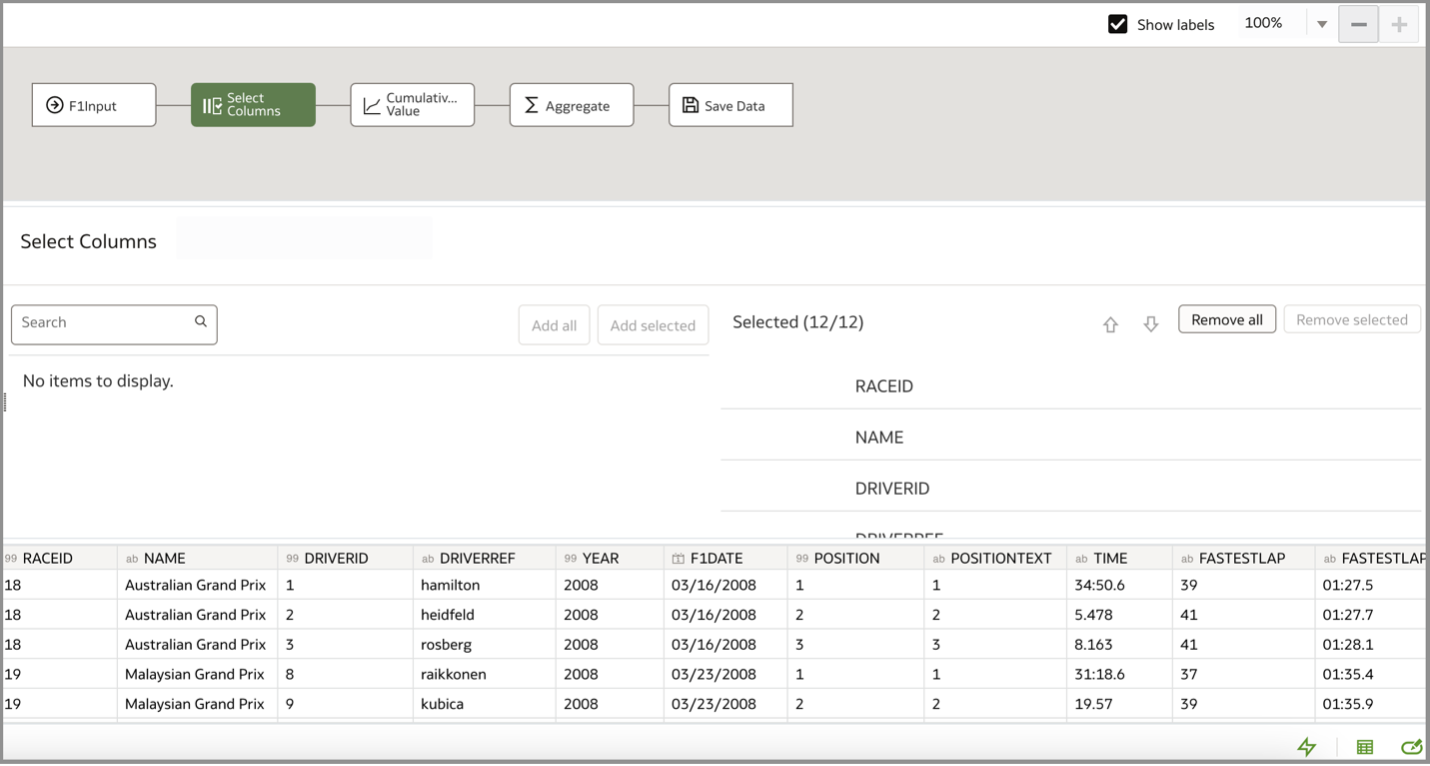
I added race data to the data flow through an Add Data step and then reordered the columns using the Select Column step. The following screenshot displays the preview query, indicating that each distinct RACEID contains corresponding details about the race and the drivers securing the first, second, and third positions.
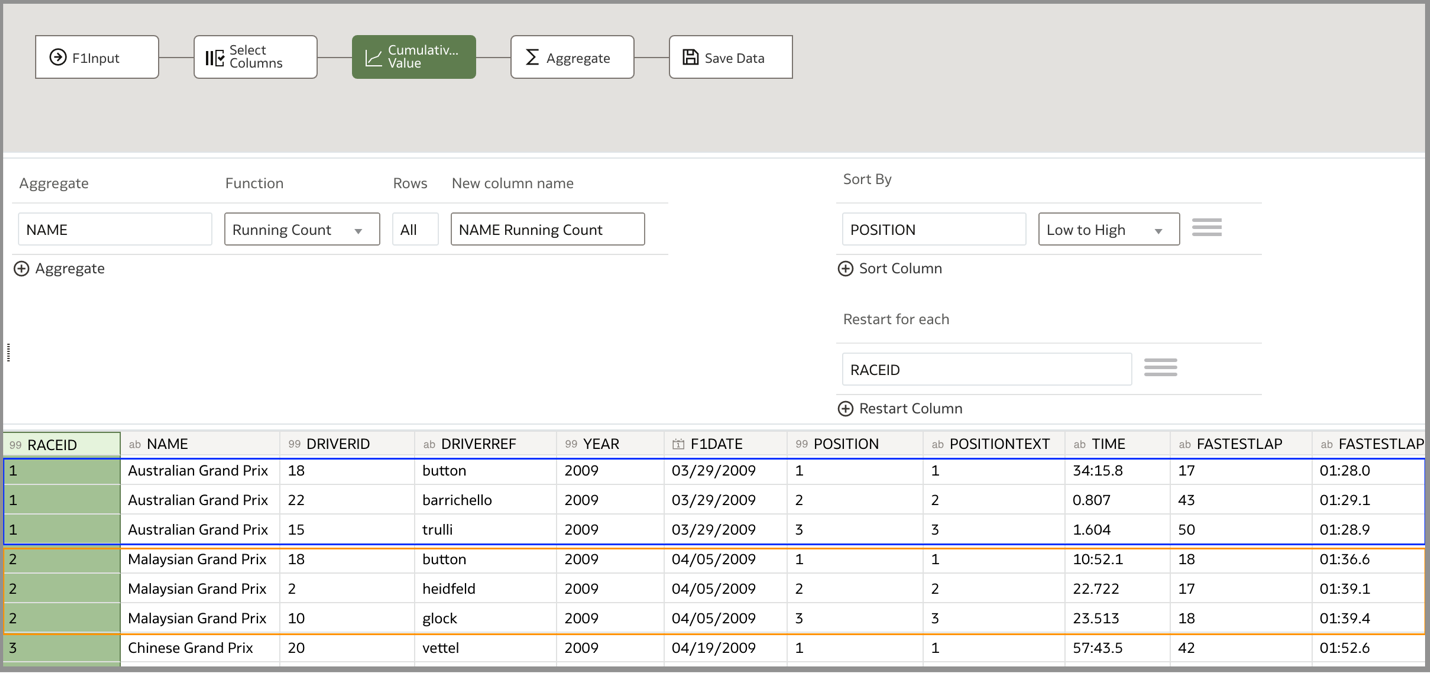
I used a Cumulative Value step as a workaround to sort the rows of data. For each RACEID, I sorted the rows by POSITION in ascending order. In the following screenshot, each colored box includes three rows associated with each RACEID where the rows are sorted by POSITION from 1 to 3.
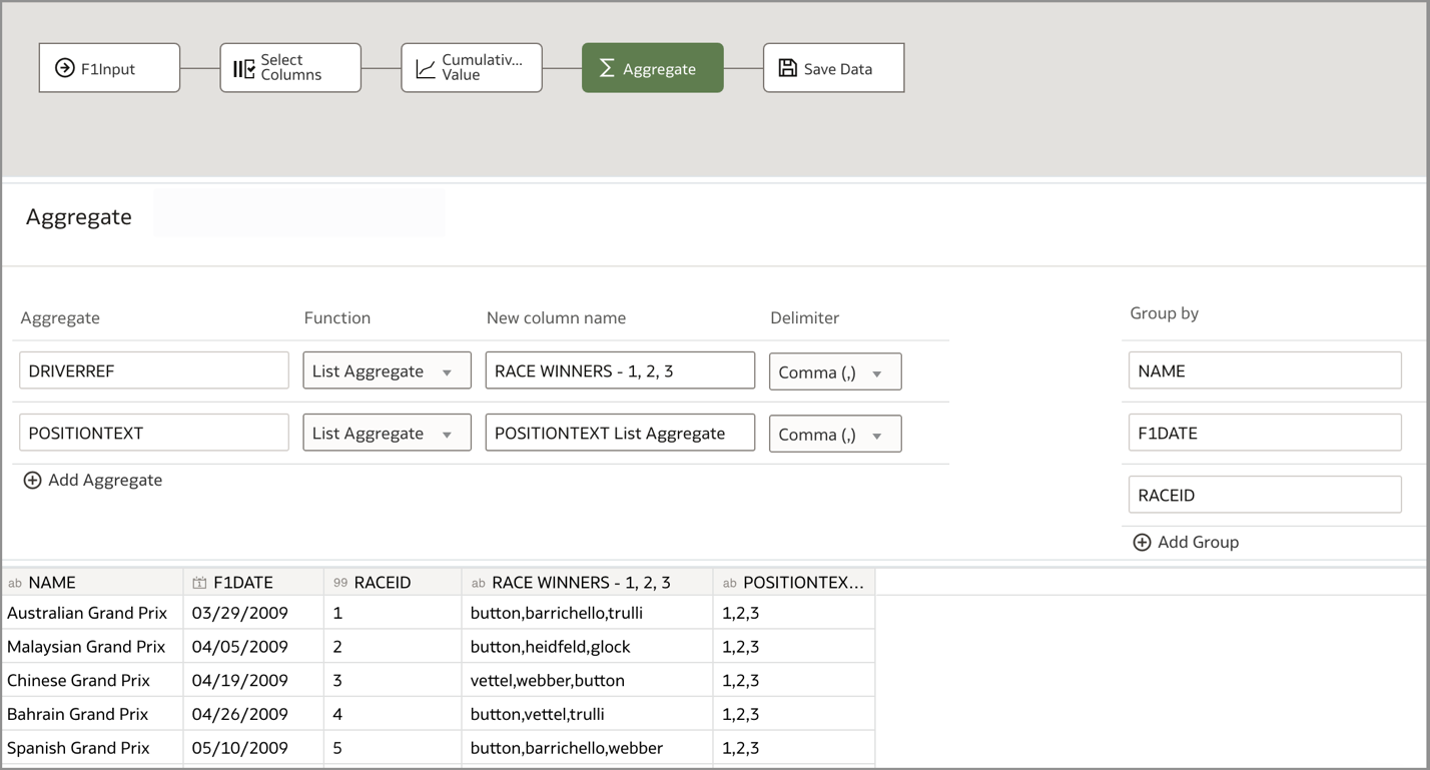
Let’s examine the Aggregate step that uses the list aggregate function to create the comma-separated list of race winners.
- In the Aggregate field, I selected the text column DRIVERREF, which contains the driver names. This is the text column in which values will be aggregated into a list.
- In the Function field, I selected the List Aggregate function and in the New column name field, I entered a name for the column that will contain the list.
- In the Delimiter field, I selected the comma (,) from the drop-down list of predefined delimiters. The comma serves as the character that will separate the elements of the list in the new column.
- In the Group by section, I selected specific columns such as NAME, F1DATE, and RACEID to group the data together for aggregation. Adding RACEID in this section ensured that the data was aggregated correctly, aligning the driver names with their corresponding race positions. This was necessary due to the utilization of RACEID in the prior Cumulative Value step within the Restart for each segment.
I repeated this process for another text field called POSITIONTEXT as a sanity check to verify that the driver names are listed in the correct order: 1, 2, 3.
I saved and ran the data flow, which generated an output dataset containing the newly transformed data. I then added this dataset to a workbook and created a table visualization to examine the results:
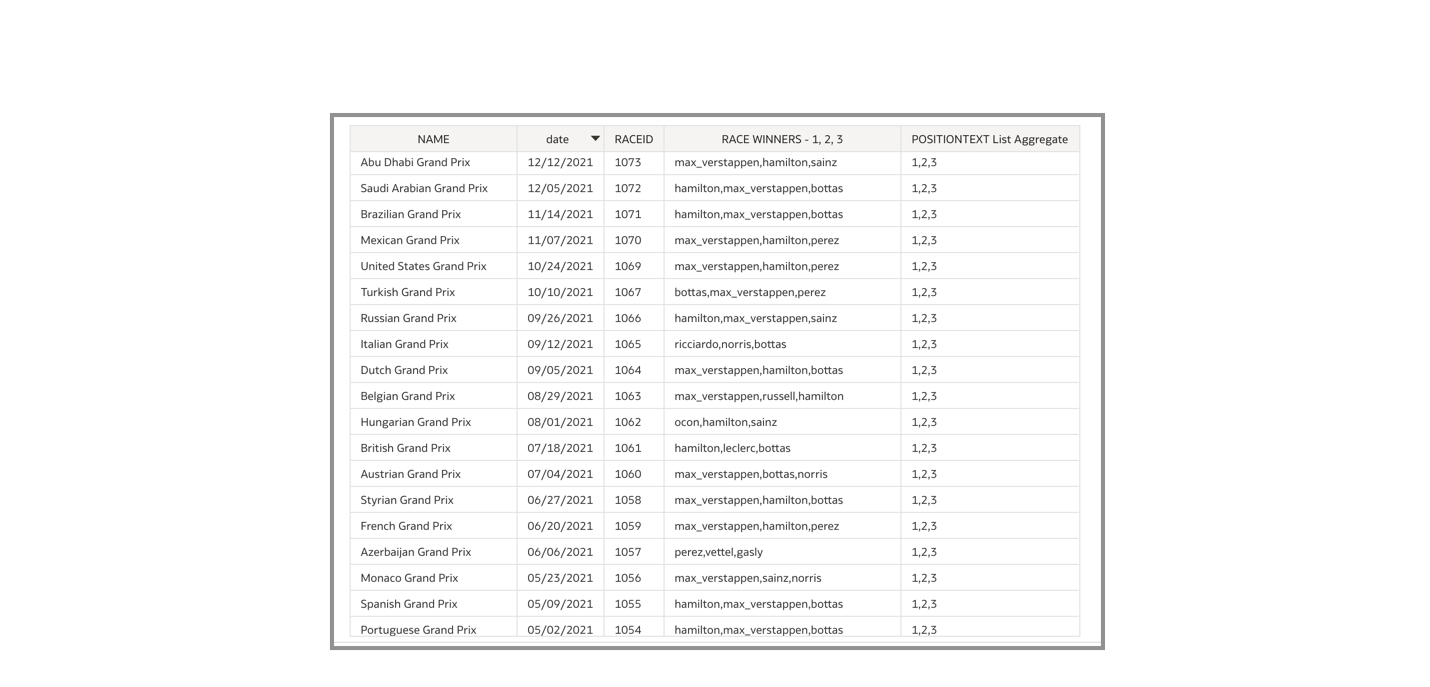
The list aggregate-generated column allows end users to conveniently view the data and identify the leading drivers for each race. Formula 1 fans are likely aware of Max Verstappen and Lewis Hamilton’s success in recent years, but for those unfamiliar with the sport, this chart effectively communicates their ability to execute and finish among the top three positions. Using list aggregation, I transformed the aggregation of the initial dataset, where each row represented a driver’s performance in a given race, into a more summarized format. The rows now represent a single race, with an additional column showcasing the top three drivers for that race.
Call to Action
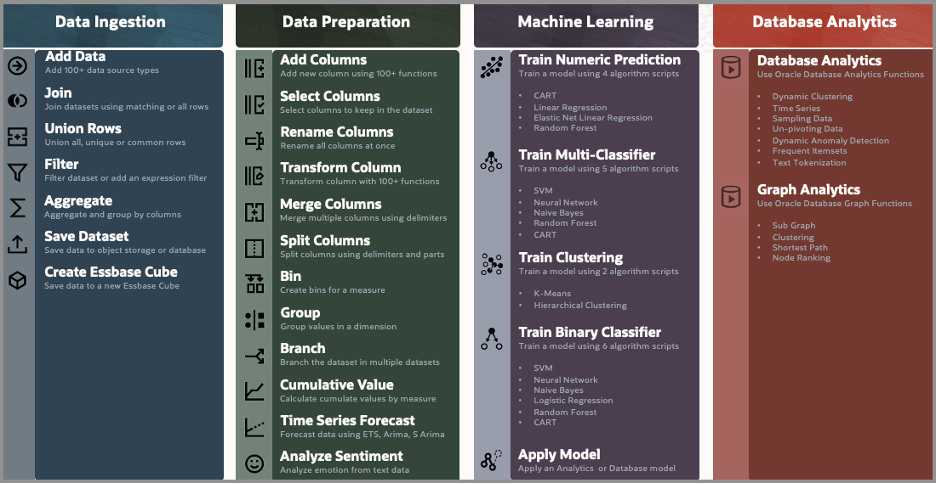
In summary, list aggregation enables users to consolidate information about related entities for reporting and analysis. List aggregation allows users to easily inspect column contents and associations (that is, products associated with certain departments, employees associated with business units, top revenue-generating customers by region, and so on). Leverage list aggregation and the other data transformations offered in data flows to create curated datasets tailored to your business requirements. For a full list of data flow capabilities, visit the documentation at this link and consult the following image.
Watch a demo video on LISTAGG on YouTube.