In many analytics use cases, spatial data brings the location dimension into the analysis, enhancing the insights you can extract from your dataset. Together with other types of data, spatial data must be visualized to show the location of the information that is being presented in a dashboard. In this blog, you will learn about what makes up a map visualization in Oracle Analytics Cloud (OAC).
A map visualization in OAC has three main components: layers, the background map, and a legend.

Map layers
Map layers contain the objects that represent your data on a map in the form of points, lines, or polygons. You can create map layers by either selecting the column that contains the spatial data and picking Map as the visualization, or by simply dragging the column to Category (Location) in the map visualization grammar. For the step-by-step process, go to this link.
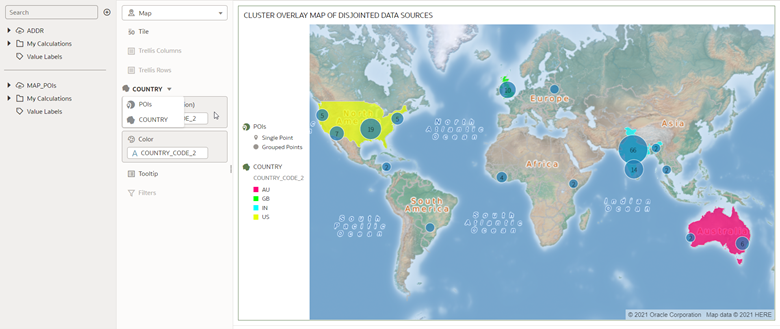
In OAC, you can add as many map layers as needed to represent your spatial data. Multiple map layers can be created from one data source or from multiple data sources. You can also create several map visualizations in one canvas, or a single map of multiple layers on top of each other, called an overlay map. Moreover, multiple map layers do not require joining of their data sources to have an overlay view. In the cluster map example below, map layers COUNTRY and POIs come from disjointed data sources – POIs from the MAP POIs dataset and COUNTRY from the ADDR dataset. Disjointed data sources are separated by a gray line in the data source pane.
OAC also allows you to manage your map layers by clicking Layer options next to map layers in the grammar, or by going to Data Layers in the Properties tab.
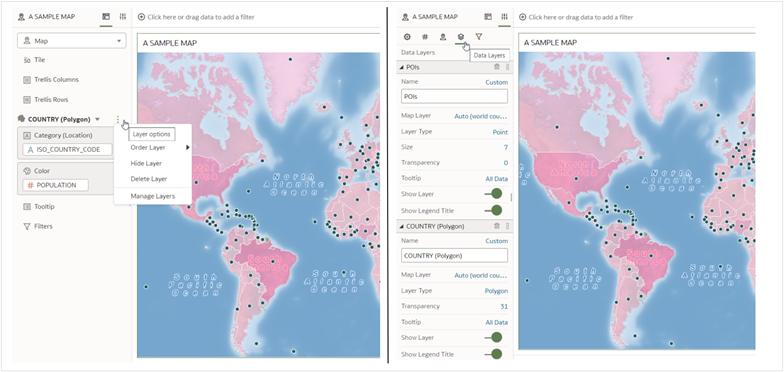
Layer options in the grammar provides quick layer management options including Add Layer, Order Layer, Hide Layer, and Delete Layer. It also has a Manage Layers option that allows you to directly navigate to data layer properties, showing all the layer settings you can modify to customize your map layers. You may also toggle on and off the layers through the map legend (see Map Legend).
The background map
The background map or base map provides a reference for the map visualization. In OAC, the default map background is an Oracle thematic world map. It ties the spatial object to its approximate location on the map background being used.
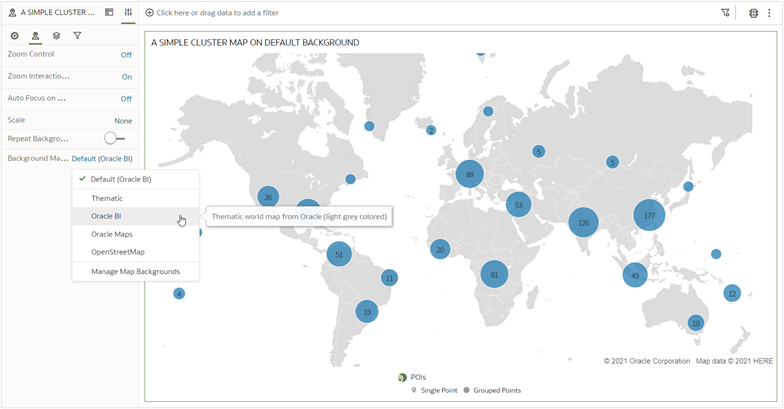
There are several ways to change the background map for map visualization. The quickest way is by going to the Map properties as shown above and selecting any background from the pre-defined list. You may also go to the Maps console by selecting Manage Map Backgrounds. Please note that the Maps console is only accessible to users with BIAdmin credentials.
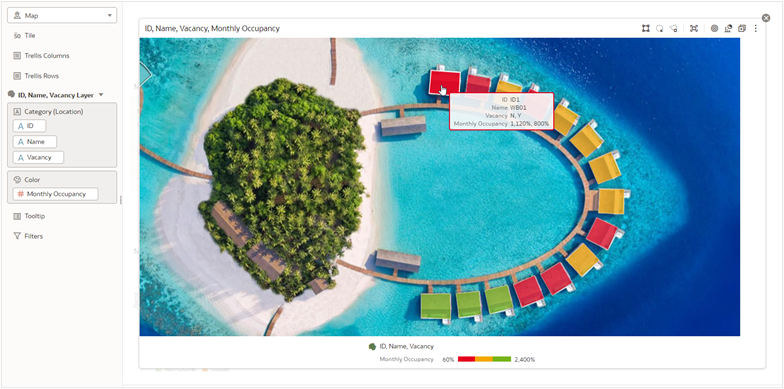
In the Maps console, there are two options for creating or adding your own backgrounds. One is by integrating map backgrounds from external sources (see more details in the documentation here). The other option is by uploading your own image file as a background and creating a map layer from it (see more details here). Below is an example of an image background with a map layer.
The map legend
Map legends help make sense of a map visualization by describing what’s shown on the map. In OAC, a map legend is created automatically by default for each map layer. OAC allows you to customize the position and text of the map legend in the general properties tab.
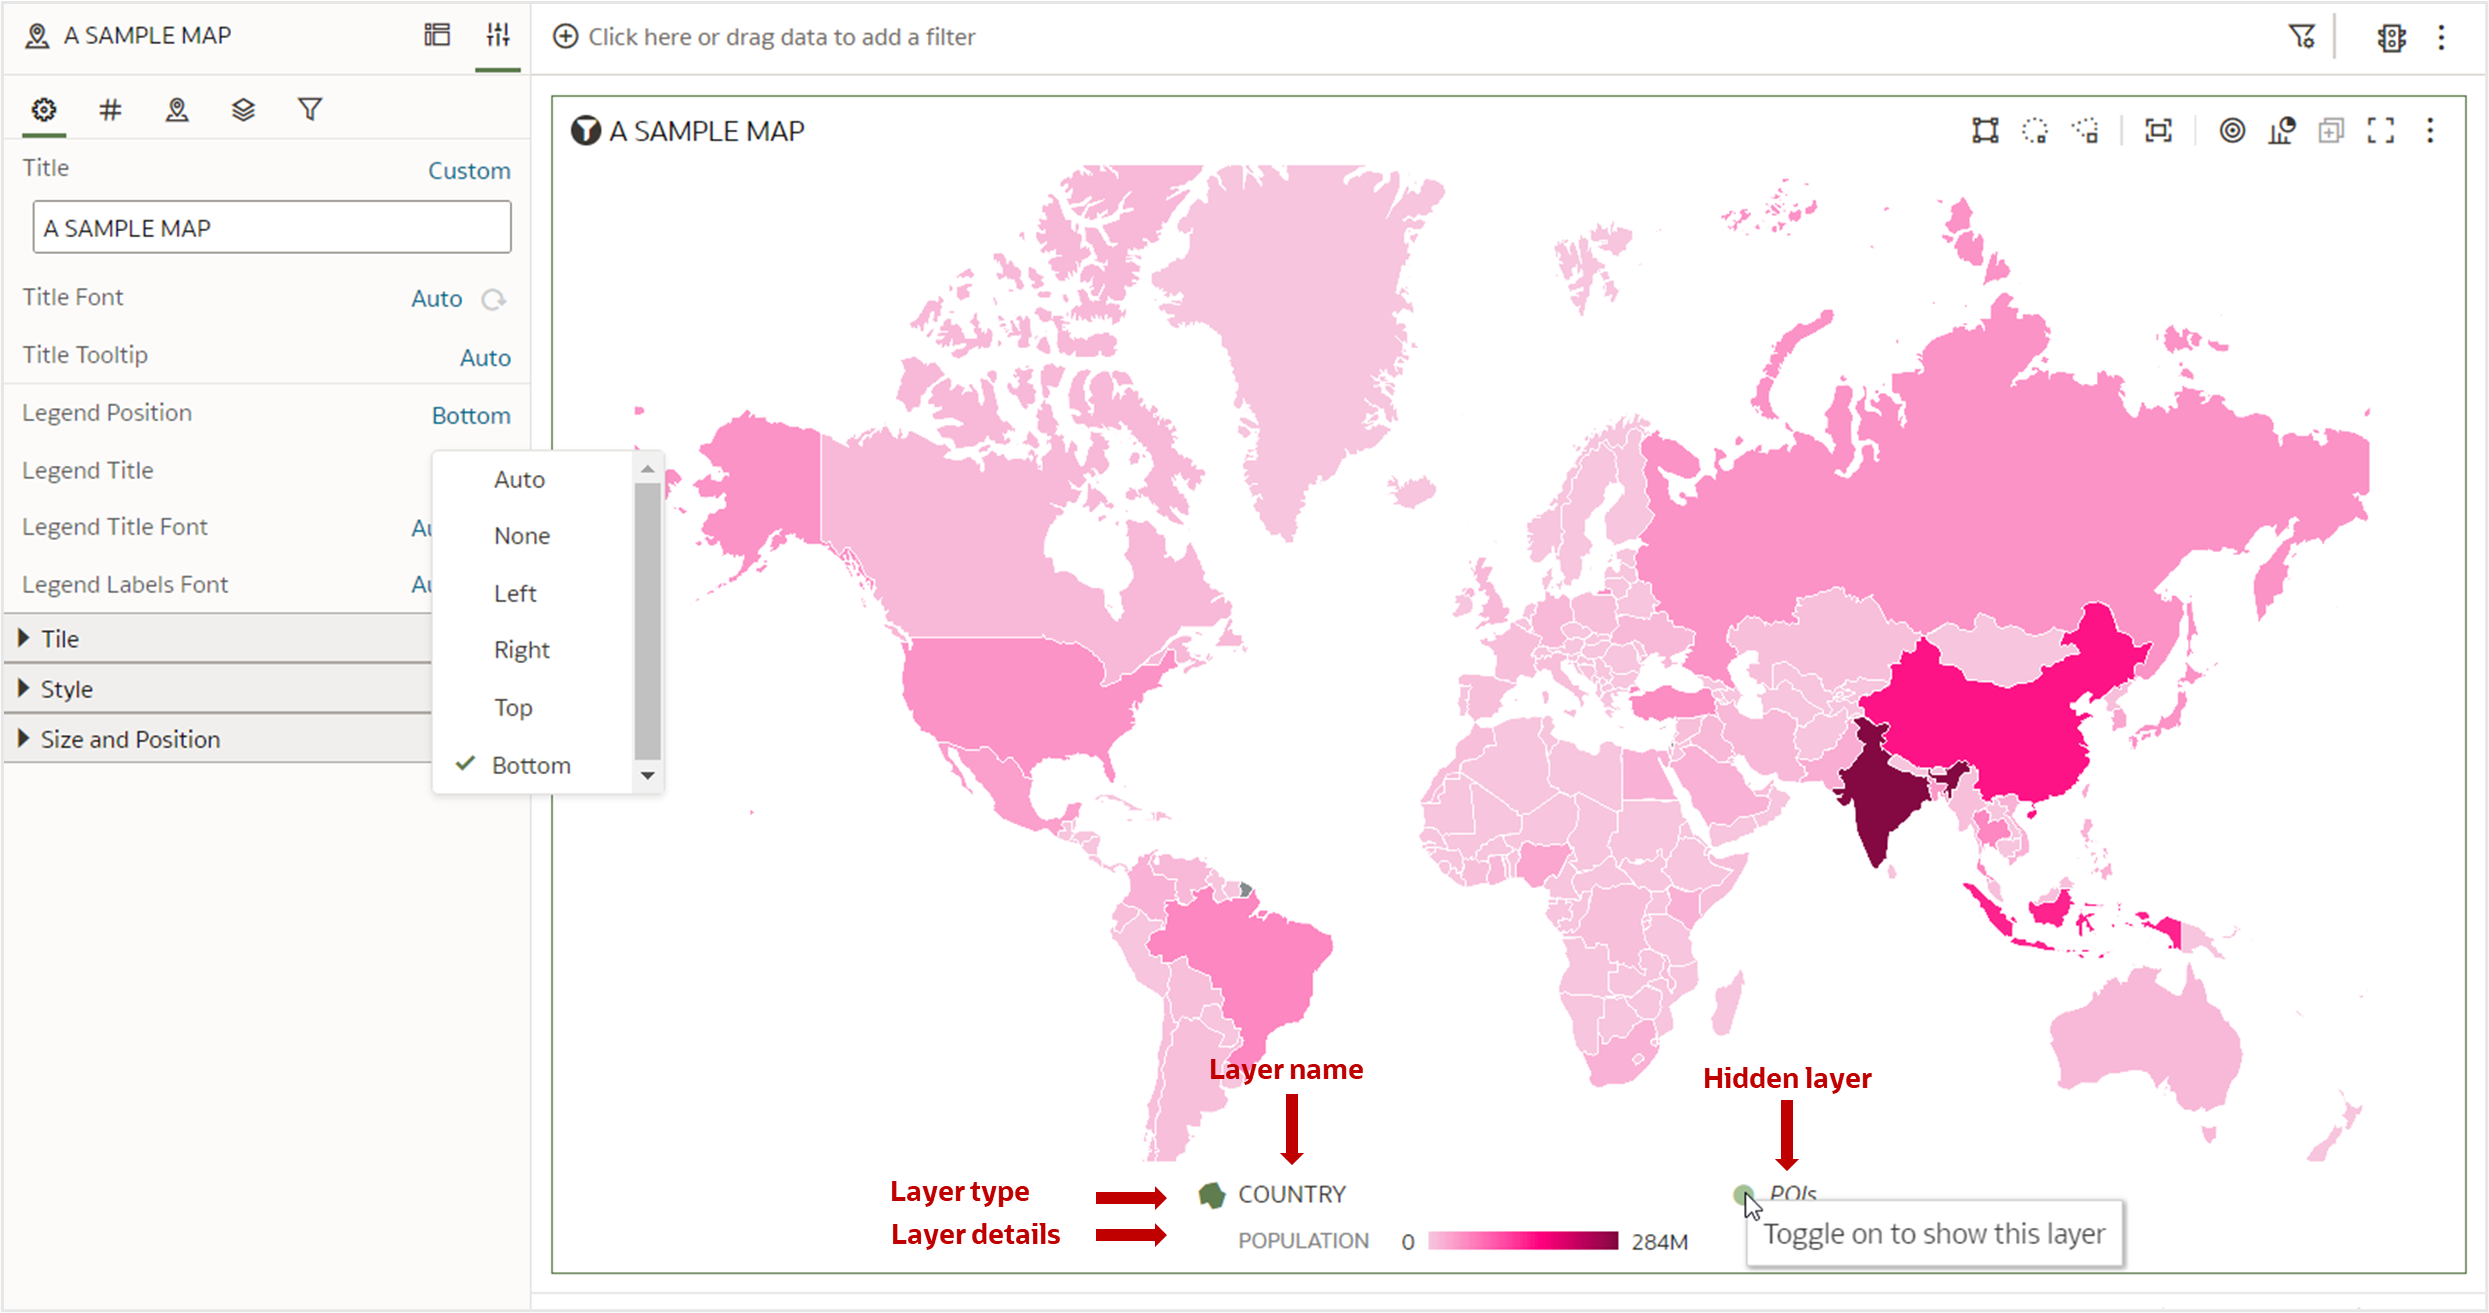
A map legend has three parts – layer name, layer type, and layer details which can be renamed in the Legend Title setting. The layer name is taken from the map layer name. The layer type is based on the data layer type setting which can either be a point, cluster, heatmap, polygon, or line depending on the spatial metadata of the dataset. The layer details show the magnitude or classification of the map layer objects based on the grammar details of the map layer. A map legend in OAC also provides a quick way to show and hide a map layer by toggling on and off the layer type legend of the map layer.
Conclusion
This blog describes the key elements of OAC maps, to help you understand how each component functions and how to create and modify them to build a compelling map visualization. I hope it helps get you started creating data visualizations with maps and enhancing your analytics insights with spatial data. If you have any questions, please post them in the OAC Community forum.