This article is part of a series of “best practices” for Oracle Analytics Cloud, as listed here.
This article describes guidelines to follow when creating reports in Oracle Analytics Cloud using Enterprise Performance Management Cloud as the data source. Not following these recommendations can lead to performance issues.
Reduce the number of queries
This guideline applies both to workbooks and Classic analyses. It also applies both to the Data Visualizer connector and to the connections defined in a repository.
Reduce the number of physical queries. For instance, Oracle Analytics Cloud generates one query for each “filter(… using …)” function used in expressions. This produces a large number of queries. Always ensure that you define appropriate filters so that reducing the number of queries doesn’t increase the volume of data selected. The best solution depends on the context. See the following examples.
Example 1: Add the dimension attribute column in the report instead of filtering on it in each metric. For instance, instead of four metrics, each filtered on a different period, add the period column in the report and define a global filter.
Select year, Continent, Product Category,
Filter(value using period=’Q1’),
Filter(value using period=’Q2’),
Filter(value using period=’Q3’),
Filter(value using period=’Q4’)
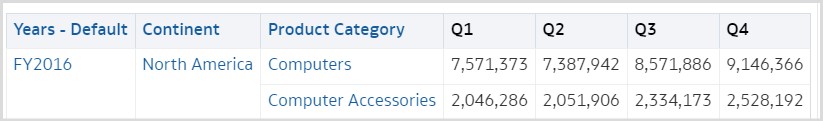
This generates four physical queries. However, if you replace the query as shown in this sample code:
Select year, Continent, Product Category, period, value
Where period in (‘Q1’, ‘Q2’, ‘Q3’,’Q4’)
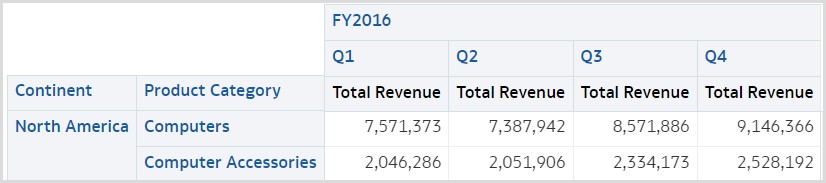
Then, it generates only one physical query.
Example 2: Replace the filter functions with case statements to generate only one physical query and aggregate the data on the server:
Select
Filter(value using Country in ('United Kingdom', 'Netherlands', 'Norway', 'Sweden')),
Filter(value using Country in ('France', 'Germany', 'Poland')),
Filter(value using Country" not in ('United Kingdom', 'Netherlands', 'Norway', 'Sweden', 'France', 'Germany', 'Poland'))
After optimization, this becomes:
Select
Case when Country in ('United Kingdom', 'Netherlands', 'Norway', 'Sweden') then 'North Europe'
when Country in ('France', 'Germany', 'Poland') then 'Central Europe'
else 'Other' end,
valuesum
Configure settings to cancel long-running queries
Oracle Analytics Cloud usually automatically cancels long-running queries. However, automatic cancellation isn’t supported currently with Enterprise Performance Management Cloud. Long-running queries can run for days, blocking resources on both services.
As a workaround, use the query cancellation setting on Enterprise Performance Management Cloud, as described in the documentation. This setting impacts queries that extract data, such as queries from Oracle Analytics Cloud or Smartview. It doesn’t impact Enterprise Performance Management’s internal processes. Don’t exceed 600 seconds.
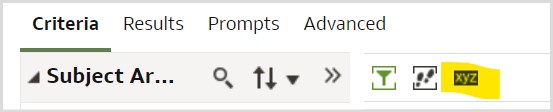
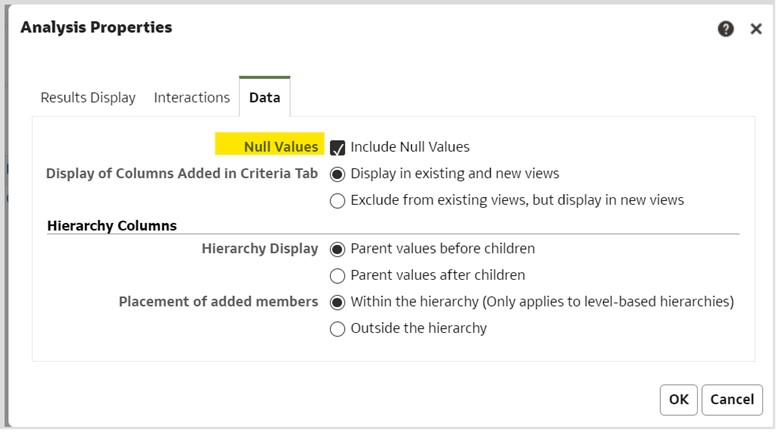
Don’t enable “Include Null Values”
This guideline applies to Classic analyses only. If you set the option to “Include Null Values” on the Data page of the Analysis Properties, then every dimension value is listed in the results even when there’s no metric value. This requires more queries to get the null values. Do not select this option. You can identify these reports in usage tracking because enabling this option modifies the logical SQL code to include the UNSUPRESSED keyword.
Remove excluded columns from reports
This guideline applies only to Classic analyses. Except in very particular use cases, delete from reports the columns that are excluded from all views.
Reduce the volume of data retrieved
This guideline applies only when using a connection through the repository.
When the cube structure is imported into the repository’s physical layer, all columns have the default size set to 100. Data is manipulated using fixed length. So, reduce the size of the columns used in the physical layer of the repository to a realistic size to reduce significantly the memory used.
Reduce as much as possible the volume selected. Check the volume selected in bytes for each physical query in the query log, as shown in this example.

Reduce the impact of network latency
This guideline applies only when using a connection through the repository.
When Oracle Analytics Cloud communicates with an Enterprise Performance Management Cloud located in a separate data center, network latency rises. To mitigate the impact, decrease the number of network roundtrips between the two services. This enhances the speed and efficiency of database query responses.
Adjust the DEFAULT_BULK_FETCH_ROW_COUNT setting to 5000, and the MAX_BULK_FETCH_BUFFER_SIZE to 10 000 000 in the database features properties in the physical layer of the repository.
Enable immediate dashboard rendering
This guideline applies only to Classic analyses.
Administrators control how dashboards are rendered in the system settings in the Console, using the property called Enable Immediate Dashboard Rendering. The property has these settings:
- On – Specifies to render dashboard content immediately, even if some content is unavailable.
- Off (default) – Specifies to wait for all dashboard content to be loaded before rendering.
Tuning Connection Pool in OAC RPD
Calculating the maximum connection pool value in Repository (RPD) involves considering several factors related to your specific environment and usage patterns:
- Assess Your User Base and Usage Patterns: Understand how many users are accessing the system simultaneously. Not all users will be active at the same time, but you need to have an estimate of peak usage. Set the maximum connections to 10% to 20% of the simultaneous users multiplied by the maximum number of total physical queries spawned on any given dashboard.
- EPM (PBCS) Capacity: The capacity of the EPM to handle connections is crucial. If your EPM can handle 100 connections at a time, setting a higher number in OAC won’t be beneficial. For example, in your EPM tenancy check for API rate limits.
- Load Testing in a Staging Environment: It’s often recommended to test different maximum connection pool settings in a controlled environment to see how they affect performance.
- Monitoring and Adjusting: Start with a conservative number and monitor the system performance. If you notice that the connections are getting maxed out but the system is still performing well, you can increase the number. Conversely, if you observe performance issues, you might need to reduce the number.
Call to action
Implement the guidelines described in this article to improve the performance and stability of your Oracle Analytics Cloud environment. For more detailed information, consult these resources: