Today’s analytics needs generally fall into two distinct buckets. Each bucket covers a different set of analytics requirements and use cases. Gartner originally introduced the concept of bimodal practices, calling these two buckets “Mode 1” and “Mode 2”. Before the cloud era, various BI tools (e.g., Cognos, Business Objects, and Oracle Business Intelligence (aka OBIEE)) predominantly delivered analytics in mode 1. IT was responsible for purchasing the corporate BI tool and all the report development. As business groups accelerated with digital transformation, waiting on IT became a bottleneck as reports and the data therein were too stale to make good decisions. This led to the next generation of mode 2 self-service analytics visualization tools. However, the self-service mode created many new challenges like inconsistent numbers and lack of governance and security. Today, businesses don’t decide to be mode 1 or mode 2; instead, every organization needs both.
What is mode 1 analytics?
Mode 1 analytics is defined as reporting subjects or questions that are more predictable and well-understood meaning that the requirements for analytics output, or the business question to be answered, is clearly defined. In this scenario, businesspeople would create report definitions and pass those onto report or dashboard builders who have knowledge of the enterprise source systems and how the data therein is stored. Additionally, they can competently use their corporate standard analytics tools to build the best reports and dashboards possible. These report builders may or may not reside within IT – what’s clear is that they’re a distinct and separate group that offers analytics as a service to the business groups. In this mode, reports are created, tested, and published centrally and then shared outwards. For example, a finance user may define and request a profitability report for a specific region from the developers. The developers build the report to specification, publish the report into a shared report repository and schedule it for regular data refreshes. The finance user can then log into their analytics platform, locate, open the report and consume the required information. In essence, this becomes a “push” scenario, where reports and dashboards are created centrally and “pushed” out to the user communities. Another classic use case for mode 1 analytics is high velocity, pixel-perfect burst reports, where a predefined report template is rendered many times with data specific to the user that will receive it.
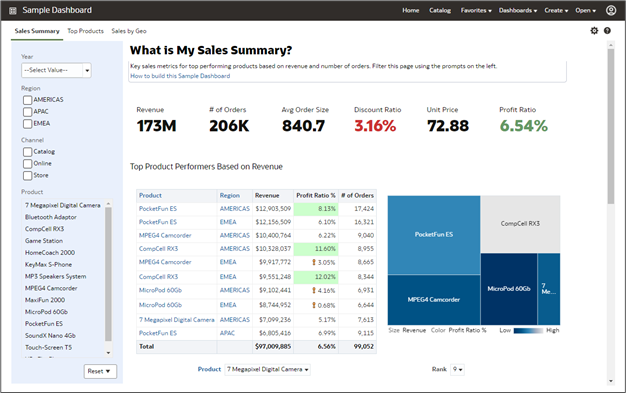
Mode 1 is the traditional or classic style of Business Intelligence (BI), where reports are built and governed centrally to ensure consistency.
What is mode 2 analytics?
Mode 2 analytics is defined as exploratory or experimental requirements that solve new problems and are optimized more for areas of uncertainty. Unlike mode 1, the business question is constantly changing and hard to define upfront clearly. Mode 2 is more exploratory means the business users connect directly to source systems and can find data patterns and trends that they otherwise would not have known to ask for. In fact through the act of data exploration and discovery the user can begin to define the business question more clearly. There are no developers standing between the business user and the data – removing the wait on long report build times. This means the business user with the question relies on easy-to-use self-service analytics tools to sift through their data to find the answer to the immediate question.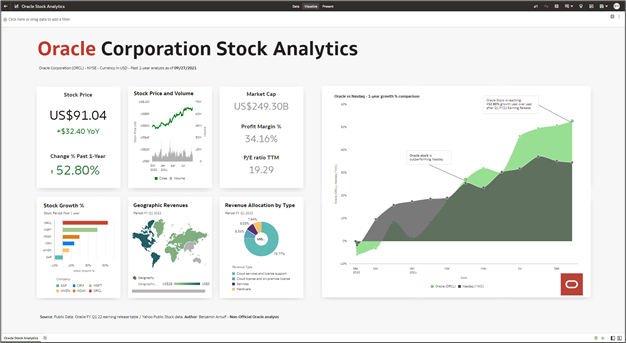
Mode 2 is the business-led self-service exploration and discovery capabilities of modern analytics platforms.
Do you need both mode 1 and mode 2 analytics?
Absolutely. All companies have both types of business questions, clearly defined, reoccurring queries, and those that require business-led self-service exploration and discovery to understand. As such, a good analytics platform should be able to competently address both mode 1 and mode 2 analytics styles. Many tools on the market today only do one mode well yet claim they do both. Using a well-known analogy, companies have both square and round holes, but only a single square peg that works very well in only one scenario
Do you need separate analytics tools for each mode?
No, and in fact it’s better if you have a single integrated platform for analytics that can address the needs of both mode 1 and mode 2 analytics. If you had separate tools that each use independent metric definitions, then it’s possible that data transformation is defined differently in the two tools. This presents an issue where reports with common metrics from the two tools produce different numbers. Then how do you know which report is correct? This leads to long reconciliation efforts and time-wasting to get trusted numbers.
Different data for different modes?
Generally, no, because both modes should easily access any relevant data to answer the current question. This includes enterprise applications (HCM, ERP, CX), data warehouses, and 3rd party provided data sets (e.g., stock indices, supplier data). The actual data any user sees should be governed by the centralized security model regardless of which mode of analytics access is used. With mode 2 and self-service, the business user can also include personal or local data sets, like XLS or CSV files, that originate from their desktop.
Does Oracle Analytics deliver mode 1 or mode 2 analytics?
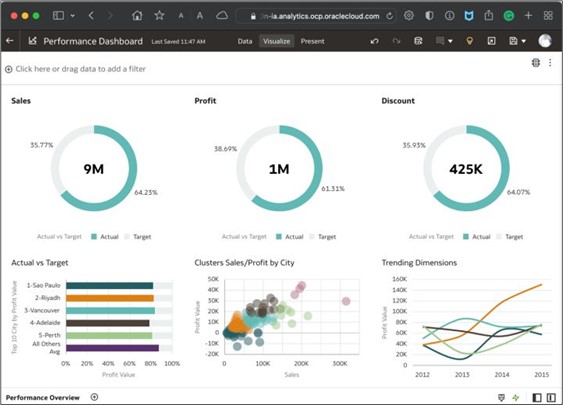
Oracle Analytics delivers both modes. The legacy tool Oracle Business Intelligence Enterprise Edition (aka OBIEE) was originally designed as a mode 1 reporting system with a centrally-managed dashboard build and delivery system. This OBIEE capability is available with Oracle Analytics Cloud today and is now called “Classic”. Oracle Analytics Publisher (aka BI Publisher), a capability of Oracle Analytics Cloud, provides pixel-perfect reports that can be scheduled and distributed to predefined destinations.
Oracle has recently developed an additional capability, native to the cloud, called Data Visualization. Data Visualization delivers mode 2 business self-service analytics. Both mode 1 and mode 2 capabilities are built on top of the common enterprise information model, or semantic layer. This ensures that business metrics whether delivered through mode 1 or 2 will always have consistent and trusted numbers. When calculations are updated, the update occurs once and both existing mode 1 reports and any new mode 2 reports immediately reflect the change.
Summary
Mode 1 and Mode 2 analytics are essential to fully address any company’s analytics needs. Mode 1 analytics is centrally built and managed to answer well-defined business questions. Mode 1 BI isn’t “old” or “legacy”; it just happens to be what the first BI tools defined and delivered. Mode 2 analytics empowers business users with self-service to explore and discover insights directly from the data. Mode 2 isn’t a successor or replacement for mode 1-it’s a natural, technological evolution that introduced new concepts like self-service and ML through a user interface designed with business users in mind. Companies should not rely on separate tools to address each mode but instead have a single integrated platform that ensures consistent numbers (a single semantic layer) that can deliver in both modes.
Read more about Oracle Analytics.
Try Oracle Analytics Cloud live on our public demo instance
Follow us on Twitter@OracleAnalytics, and connect with us on LinkedIn