Oracle Sales Strategy and Business Development, Industrial Manufacturing
Introduction
During disruptive and constantly changing market conditions it is difficult for departments to stay informed about the status of business performance. It can be difficult to track common (shared) indicators of performance among two or more business functions. Collaborating with other groups to understand cross departmental business impact is harder than ever, and the lack of a common language and measurement process can result in lower productivity and a shortfall in business results.
To understand the need and requirements for cross-departmental business analysis, Dimensional Research conducted a survey of professionals across all lines of business who indicated they have a role in business analysis. The objective of this research was to understand the types of challenges faced by people in different functions (finance, HR, sales, marketing, operations, IT, etc.), when collaborating to improve business performance . Further, the purpose was to quantify the extent of this problem and to gauge the value of an analytical solution that could provide a single, cross-departmental source of information.
The survey results show that while cross-departmental analytics can provide substantial benefits to organizations, they are typically challenging and time-consuming to operationalize
It is difficult and time-consuming to gather needed data, KPIs, and to build reports.
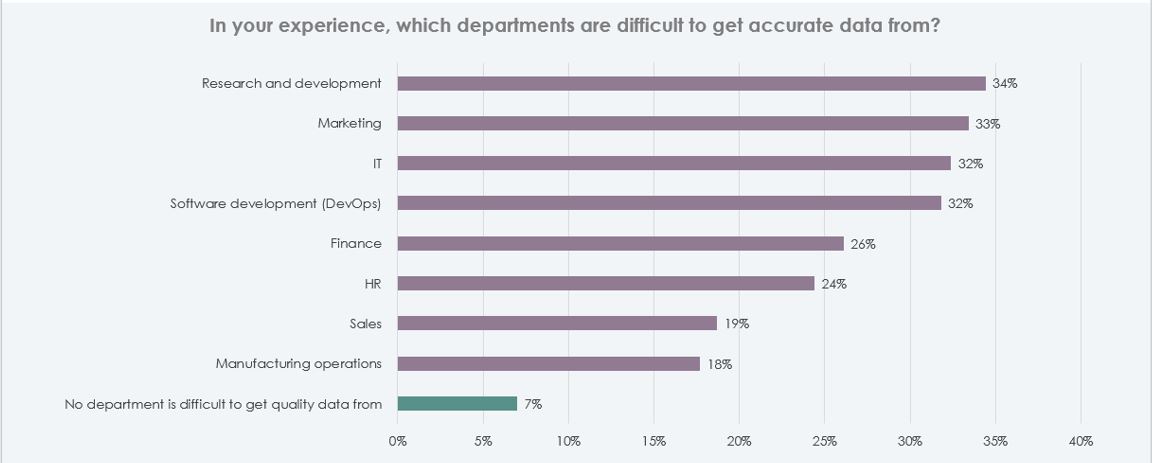
93% report it is difficult to get accurate data from other departments. Marketing, R&D, and Finance were reported as the most difficult departments to get data from. (figure 2)
Figure 1: Data from other departments. Source: Dimensional Research, 2022.
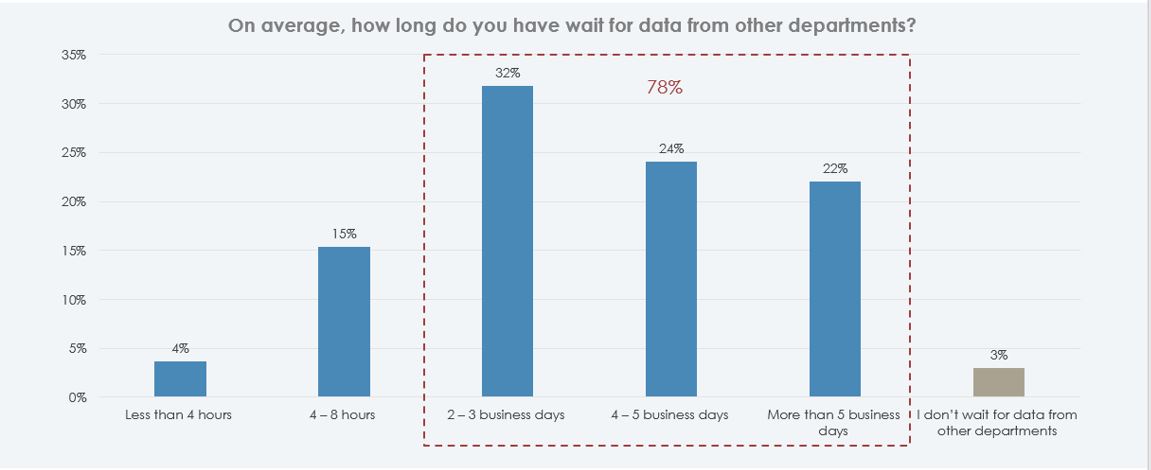
78% must wait two or more days to receive needed data. Over 75% of respondents reported a delay of at least two days waiting for needed data from other departments, with almost half (46%) claiming four or more business days.
Figure 2: Wait time for data. Source: Dimensional Research, 2022.
68% say more than 20% of their time is spent gathering data for business stakeholders, and approximately one-third report they spend over 30% of their time.
Cross departmental analytics can save time and resources by driving improved productivity, responsiveness, and competitiveness.
94% state a cross-departmental analytics solution would reduce the time to find and report key business metrics.
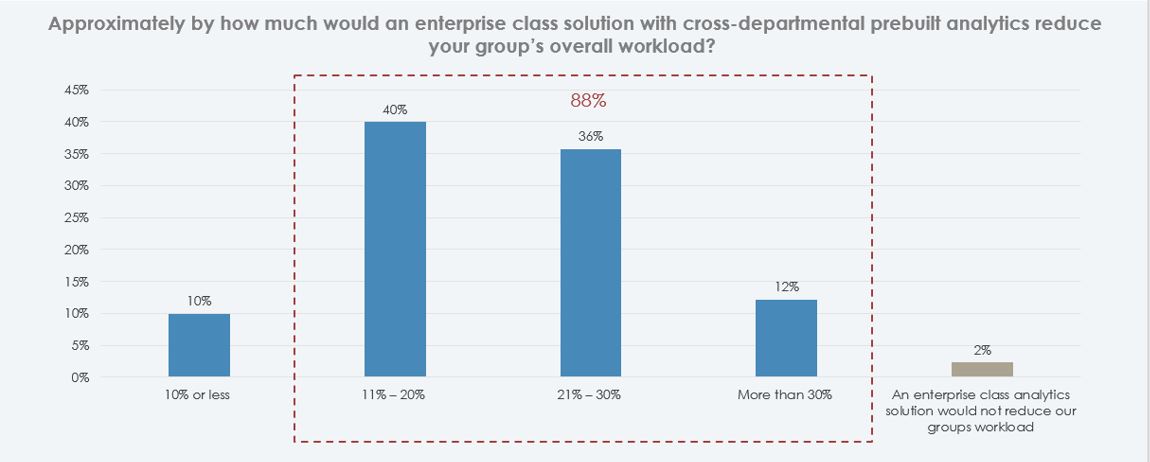
88% report a cross-departmental analytics solution with prebuilt analytics would save each group’s workload by more than 10%. Figure 3: Group workload savings per month. Source: Dimensional Research, 2022.
92% reveal they would be more productive with cross-departmental information.
Executives use KPIs to run the business but still lack timely, cross-department metrics.
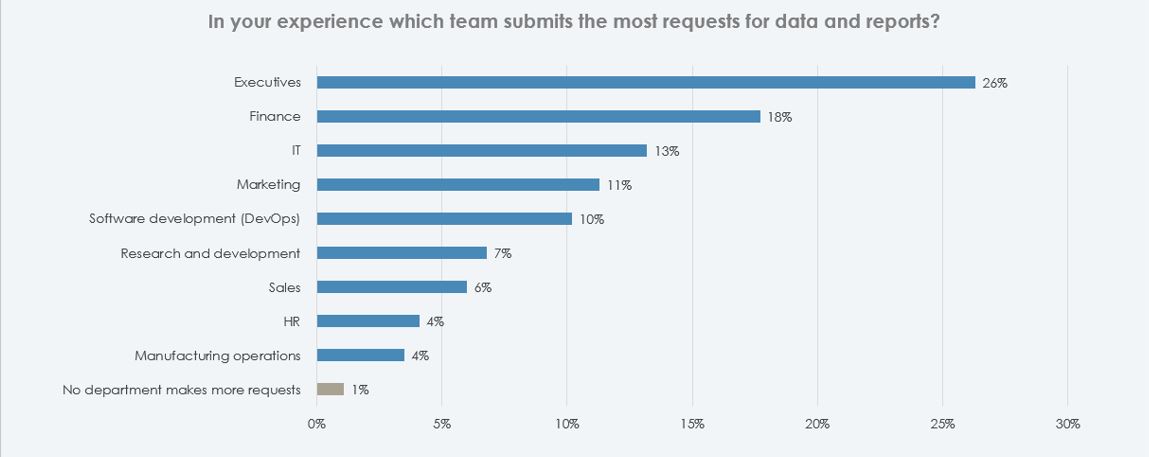
Executives represent the largest source of requests for KPIs to support business analysis and decision-making. Finance is second.
Figure 4: sources of cross department KPIs. Source: Dimensional Research, 2022.
The top cross-departmental KPI is customer satisfaction, followed by cross-departmental financial metrics and cross-departmental sales metrics.
Workforce metrics were indicated as the greatest need by other departments.
Towards a Solution
To address these challenges, what’s needed is an analytical solution that helps show the value of the data, simplifies cross-departmental collaboration, and provides a data-enabled, unified view of business performance that everyone can agree upon. This goal can be achieved through an analytical framework capable of integrating data from ERP, human capital management (HCM), supply chain management (SCM), and other relevant sources, to enable a single, common hub or “window” into business performance that everyone can see and agree upon.¹
An effective cross-departmental analytics solution adopts a unified, cross-departmental data model that encompasses supply chain, HR, finance, sales, customer satisfaction, and other departments. It must include integration with operational data sources and self-service visualization to simplify and speed usage by managers and front-line analysts. And it must provide pre-built dashboards and KPIs based on industry best practices, so people can get up and running quickly and extend their analysis with additional data from any source when needed. Oracle Fusion Analytics is designed with a common cross-functional framework to empower managers, decision-makers, and front-line workers to collaborate with their colleagues in other functions and eliminate siloed visibility and sub-optimal decision-making.²
Methodology
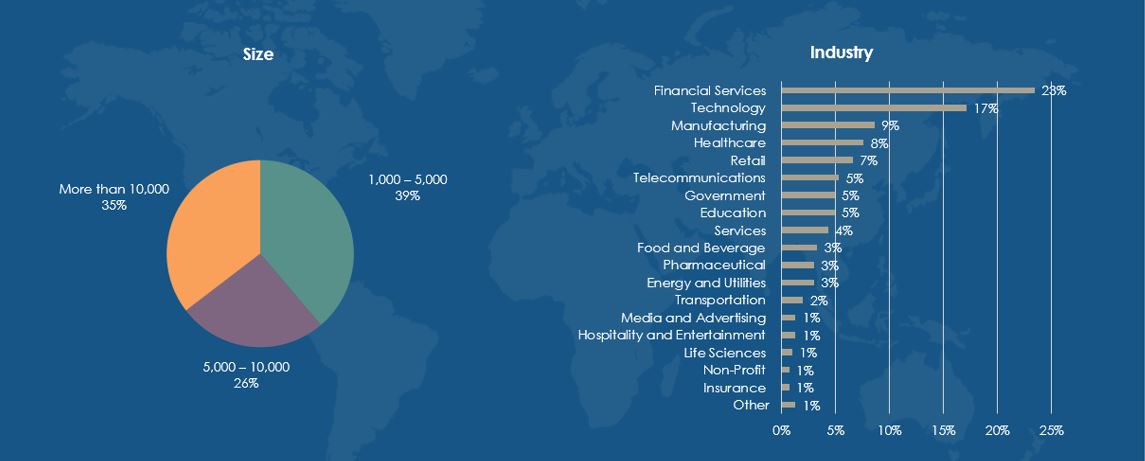
Over 300 business and IT professionals at medium to large size companies representing all seniority levels responded to a survey on their company’s use of data and key performance indicators (KPIs) for business decision-making.
In terms of company size, responses were approximately evenly split between under-5K, 5K-10K, and over-10K employees. Over 20 industries were represented with Financial Services, Technology, Manufacturing, Healthcare, and Retail composing 69% of the total. Over half of respondents were managers, with 25% frontline individual contributors and 20% executives. All major functions were represented, with Finance, Marketing, Sales, and technical representing 86% of participants. The survey was conducted in English with North America representing 78%, Europe 9%, and smaller percentages from other geographical regions.