Introduction
This article is part of a Best Practice series about Oracle Analytics Cloud (OAC) and Oracle Analytics Server (OAS). It describes ways to explicitly assign the aggregation rule for report totals, which helps improve performance, and is intended specifically for technical developers writing reports.
Report Totals
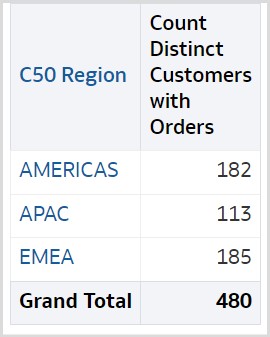
In this example, the report definition is year, month, and customer region, with a metric ‘Count Distinct of Customers with Orders’, which is defined as a count distinct of customers with orders.
Here is the logical query:
SELECT
0 s_0,
“A – Sample Sales”.”Cust Regions”.”C50 Region” s_1,
“A – Sample Sales”.”Counts”.”32 # of Cust with Orders (Cnt Distinct)” s_2,
REPORT_AGGREGATE(“A – Sample Sales”.”Counts”.”32 # of Cust with Orders (Cnt Distinct)” BY ) s_3
FROM “A – Sample Sales”
WHERE
(“Time”.”T02 Per Name Month” = ‘2011 / 11’)
ORDER BY 2 ASC NULLS LAST
FETCH FIRST 500001 ROWS ONLY
Here is the physical query that is generated:
WITH
SAWITH0 AS (select count(distinct T42433.Cust_Key) as c1,
T42430.Region as c2
from
BISAMPLE.SAMP_CUSTOMERS_D T42428 /* D60 Customers */ ,
BISAMPLE.SAMP_ADDRESSES_D T42430 /* D62 Customers Addresses */ ,
BISAMPLE.SAMP_TIME_MTH_D T42405 /* D02 Time Month Grain */ ,
BISAMPLE.SAMP_REVENUE_F T42433 /* F10 Billed Rev */
where ( T42405.Mth_Key = T42433.Bill_Mth_Key and T42405.Per_Name_Month = ‘2011 / 11’ and T42428.Cust_Key = T42433.Cust_Key and T42428.Address_Key = T42430.Address_Key )
group by T42430.Region),
SAWITH1 AS (select count(distinct T42433.Cust_Key) as c1
from
BISAMPLE.SAMP_TIME_MTH_D T42405 /* D02 Time Month Grain */ ,
BISAMPLE.SAMP_REVENUE_F T42433 /* F10 Billed Rev */
where ( T42405.Per_Name_Month = ‘2011 / 11’ and T42405.Mth_Key = T42433.Bill_Mth_Key ) )
select D1.c1 as c1, D1.c2 as c2, D1.c3 as c3, D1.c4 as c4 from ( select D1.c1 as c1,
D1.c2 as c2,
D1.c3 as c3,
D1.c4 as c4
from
(select 0 as c1,
D1.c2 as c2,
D1.c1 as c3,
D2.c1 as c4,
ROW_NUMBER() OVER (PARTITION BY D1.c2 ORDER BY D1.c2 ASC) as c5
from
SAWITH0 D1,
SAWITH1 D2
) D1
where ( D1.c5 = 1 )
order by c2 ) D1 where rownum <= 500001
The total value, 480, is the sum of the constituent values, 182 + 113 + 185. The logical query expression that calculates the total is: “REPORT_AGGREGATE(“A – Sample Sales”.”Counts”.”32 # of Cust with Orders (Cnt Distinct)” BY ) s_3”.
When “REPORT_AGGREGATE” is used, the total will be calculated independently of the constituent values. But for this report design, we determined that the correct total can be calculated from the constituents for this report.
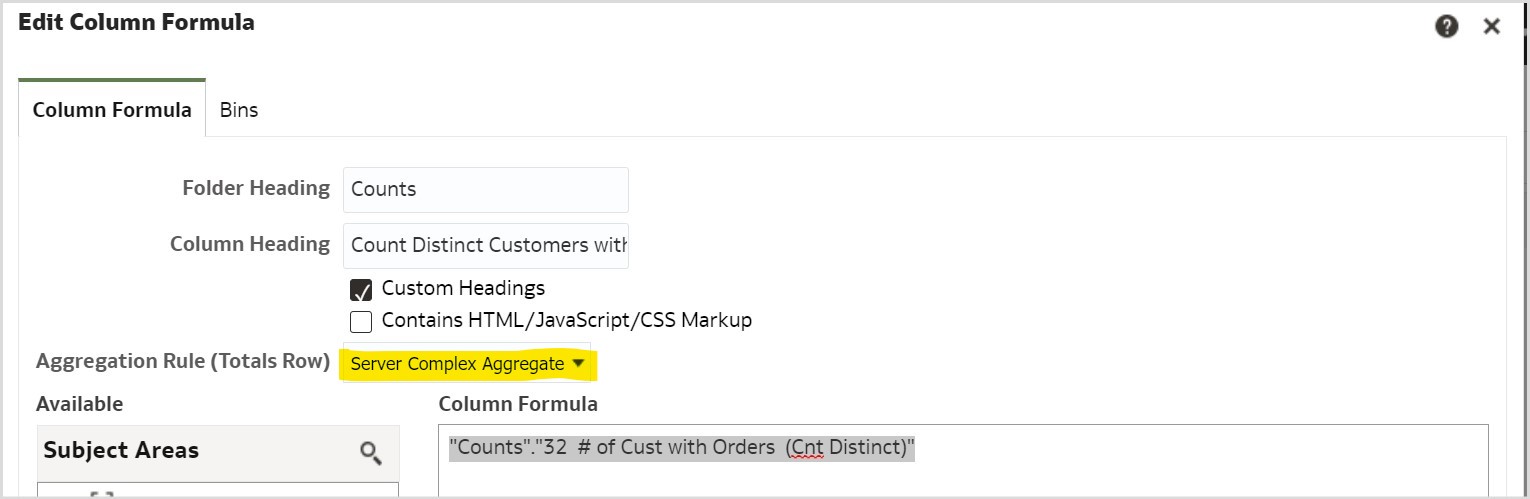
Edit the column formula to change the “Aggregation Rule (Totals Row)” from “Server Complex Aggregate” to “Sum”. This will change the logical and physical SQL.
Original Aggregation:
Modified Aggregation:
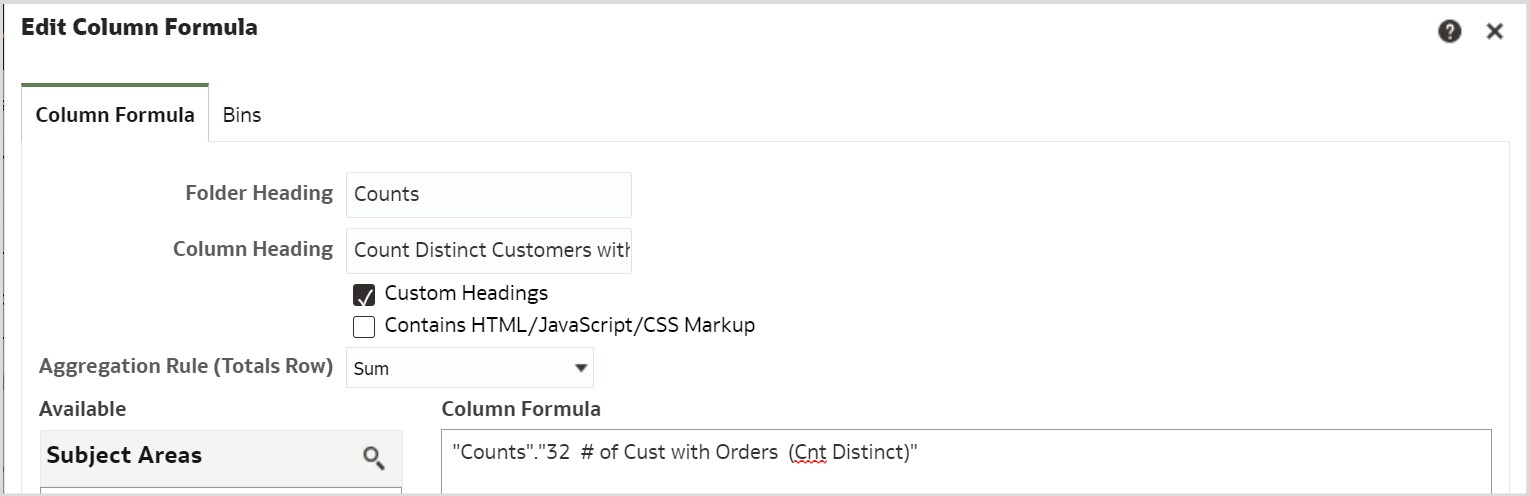
The modified logical SQL now has “REPORT_SUM”.
SELECT
0 s_0,
“A – Sample Sales”.”Cust Regions”.”C50 Region” s_1,”A – Sample Sales”.”Counts”.”32 # of Cust with Orders (Cnt Distinct)” s_2,
REPORT_SUM(“A – Sample Sales”.”Counts”.”32 # of Cust with Orders (Cnt Distinct)” BY ) s_3
FROM “A – Sample Sales”
WHERE
(“Time”.”T02 Per Name Month” = ‘2011 / 11’)
ORDER BY 2 ASC NULLS LAST
FETCH FIRST 500001 ROWS ONLY
The physical query that is generated:
WITH
SAWITH0 AS (select count(distinct T42433.Cust_Key) as c1,
T42430.Region as c2
from
BISAMPLE.SAMP_CUSTOMERS_D T42428 /* D60 Customers */ ,
BISAMPLE.SAMP_ADDRESSES_D T42430 /* D62 Customers Addresses */ ,
BISAMPLE.SAMP_TIME_MTH_D T42405 /* D02 Time Month Grain */ ,
BISAMPLE.SAMP_REVENUE_F T42433 /* F10 Billed Rev */
where ( T42405.Mth_Key = T42433.Bill_Mth_Key and T42405.Per_Name_Month = ‘2011 / 11’ and T42428.Cust_Key = T42433.Cust_Key and T42428.Address_Key = T42430.Address_Key )
group by T42430.Region),
SAWITH1 AS (select 0 as c1,
D1.c2 as c2,
D1.c1 as c3
from
SAWITH0 D1)
select D1.c1 as c1, D1.c2 as c2, D1.c3 as c3, D1.c4 as c4 from ( select D1.c1 as c1,
D1.c2 as c2,
D1.c3 as c3,
sum(D1.c3) over () as c4
from
SAWITH1 D1
order by c2 ) D1 where rownum <= 500001
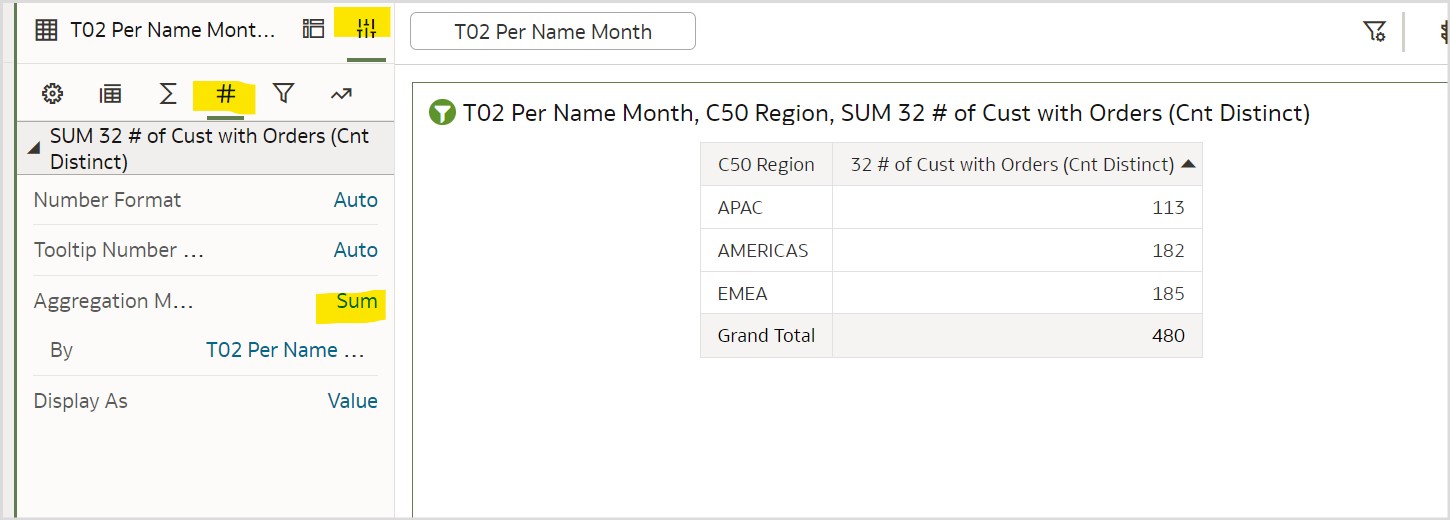
The same option to explicitly set the aggregation is available in data visualization:
Call to action
Review your reports to see that the best aggregation rule is being used for the report. Use an explicit aggregation rule when the report design allows it.
For more information on reports, review the documentation here and here for data visualization.
To learn more about Oracle Analytics, visit oracle.com/analytics, follow us on twitter@OracleAnalytics, and connect with us on LinkedIn.